
1.34
MSFT's beta vs the S&P 500 — it moved 34% more than the market over the period
1.16
AAPL's beta — 16% more volatile than the market
Friday
The day AAPL most often hit its monthly high; lows clustered on Thursdays
6
Analyses per query: moving average, monthly overview, daily ROI, monthly ROI, risk, frequency trends
What the tool shows
Four of the six views, from trend to timing.
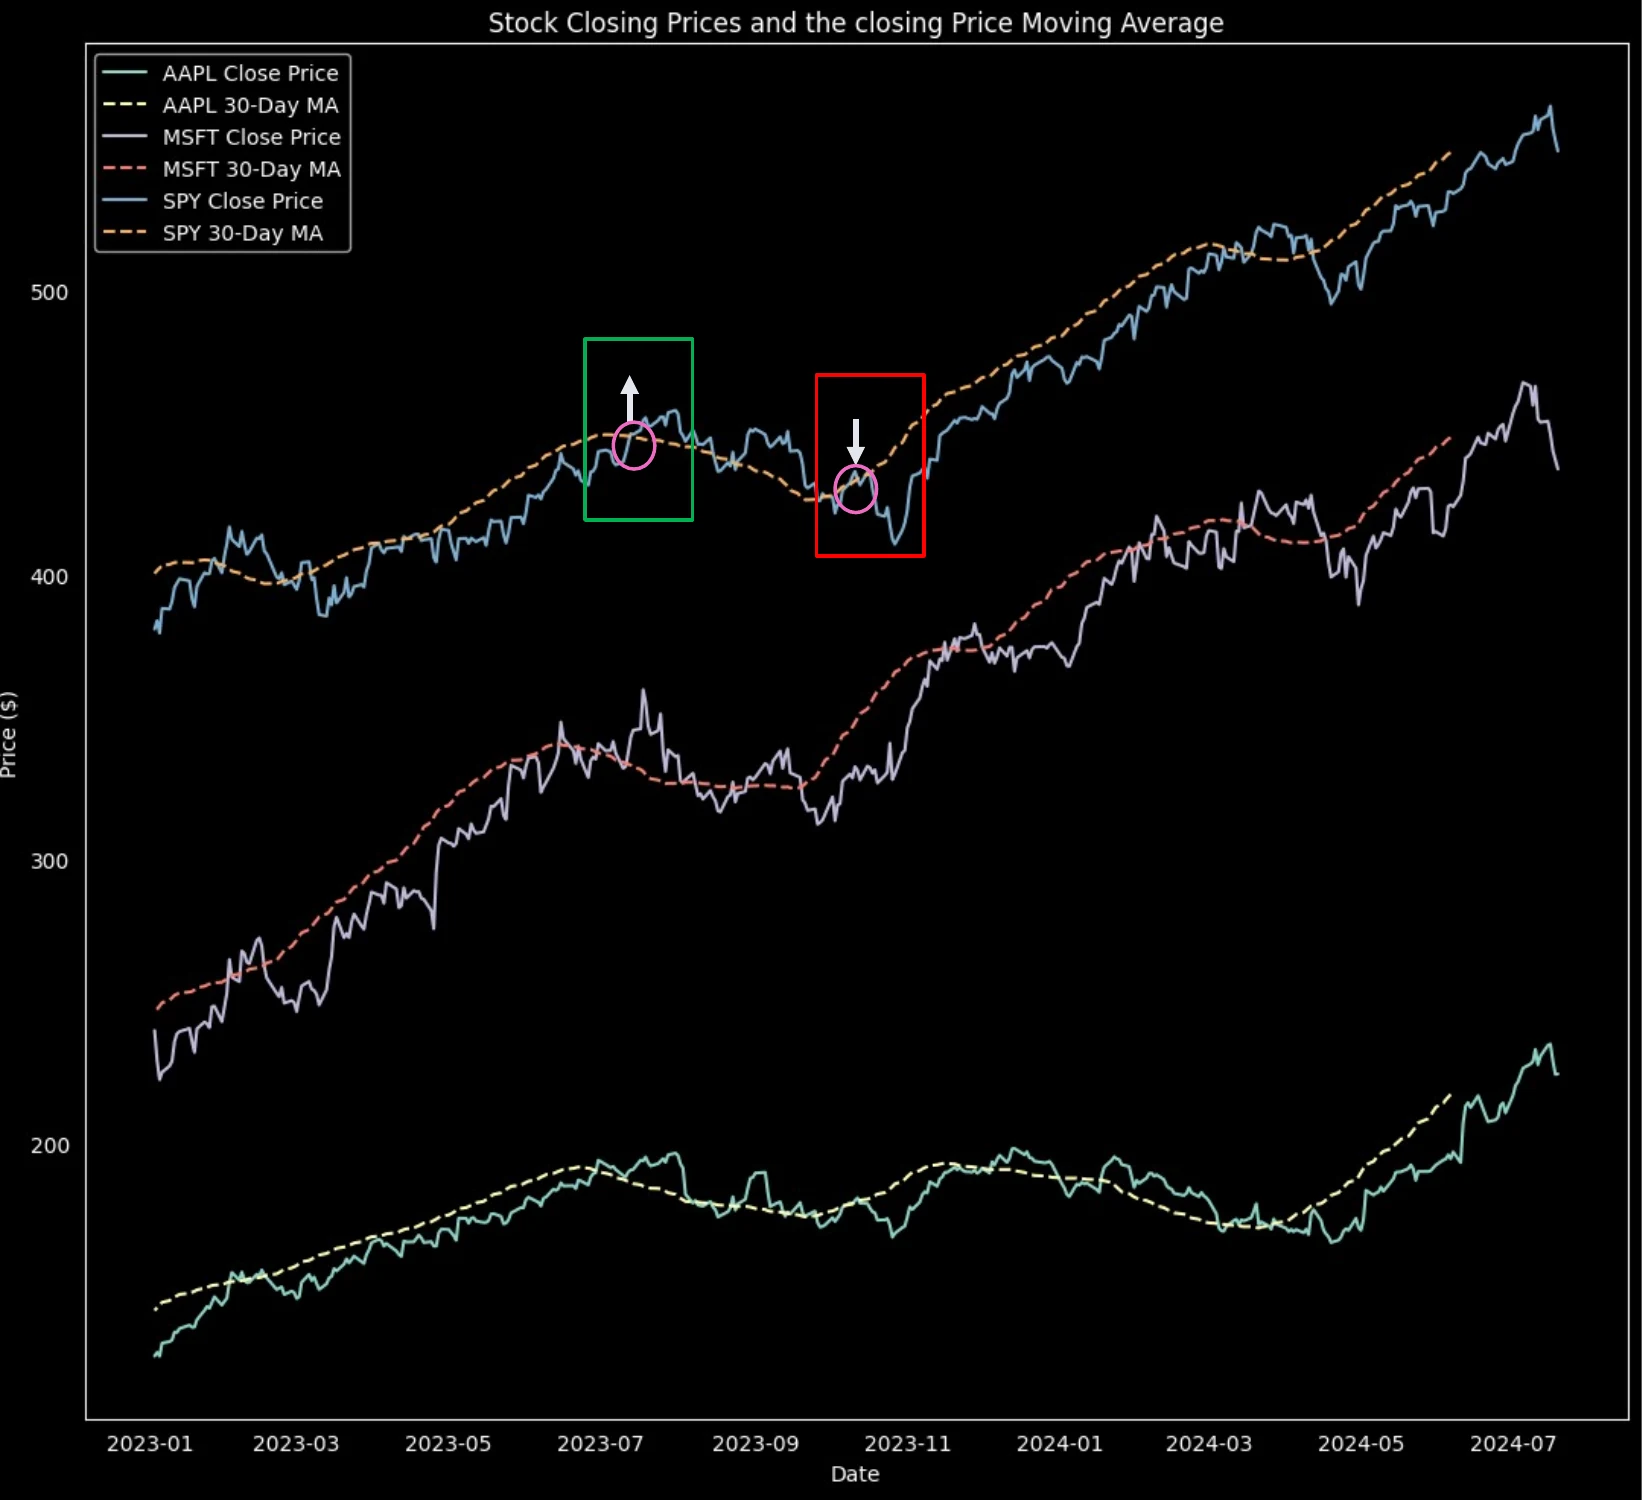
Price vs 30-day moving average
Closing price against its 30-day moving average for AAPL, MSFT and SPY. Where price crosses the average is the signal the tool highlights.
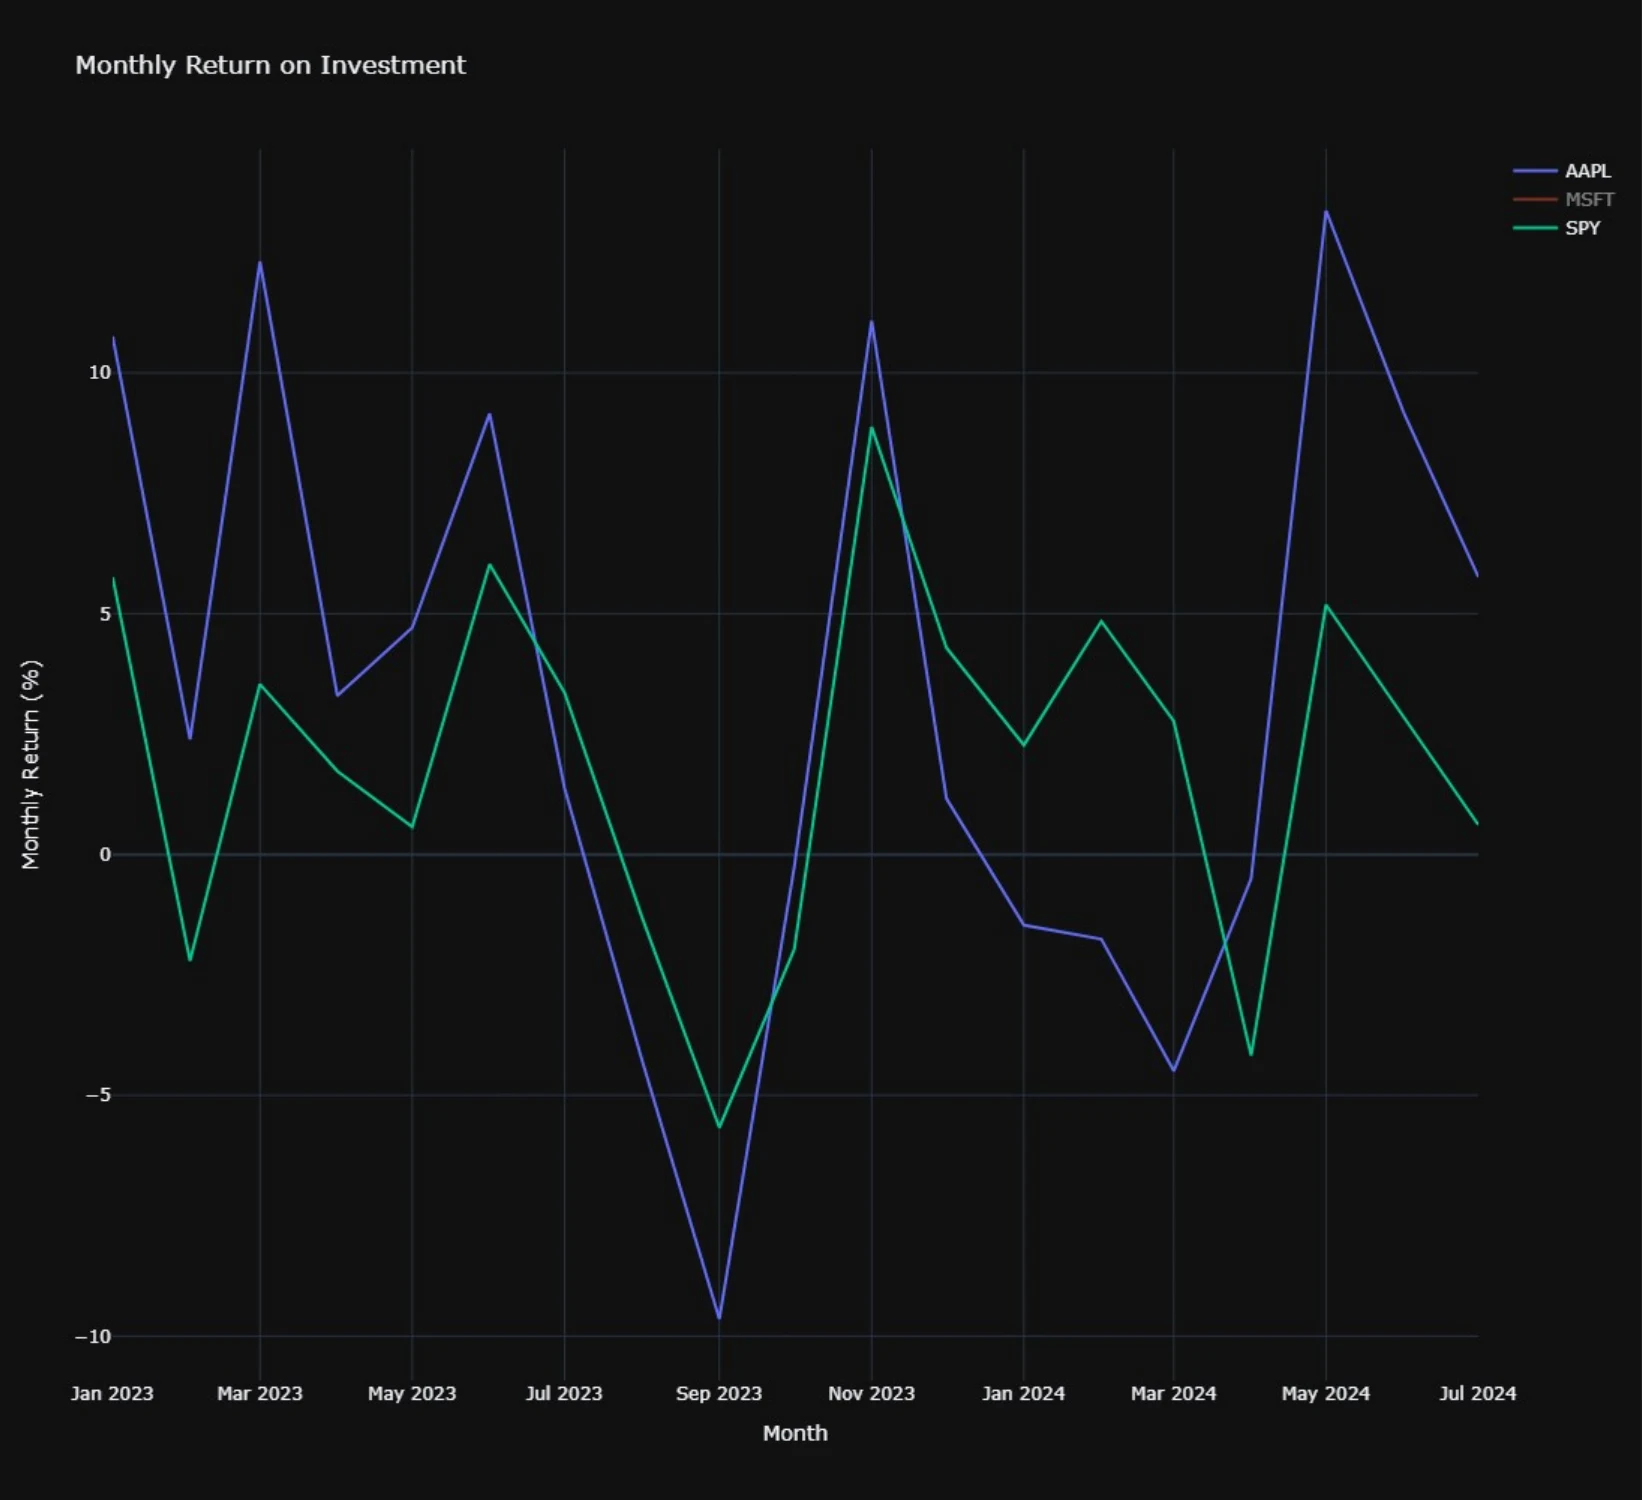
Monthly return on investment
Monthly ROI for each ticker, calculated from the first open and last close of the month. All three dropped in Sept 2023 and recovered by November.
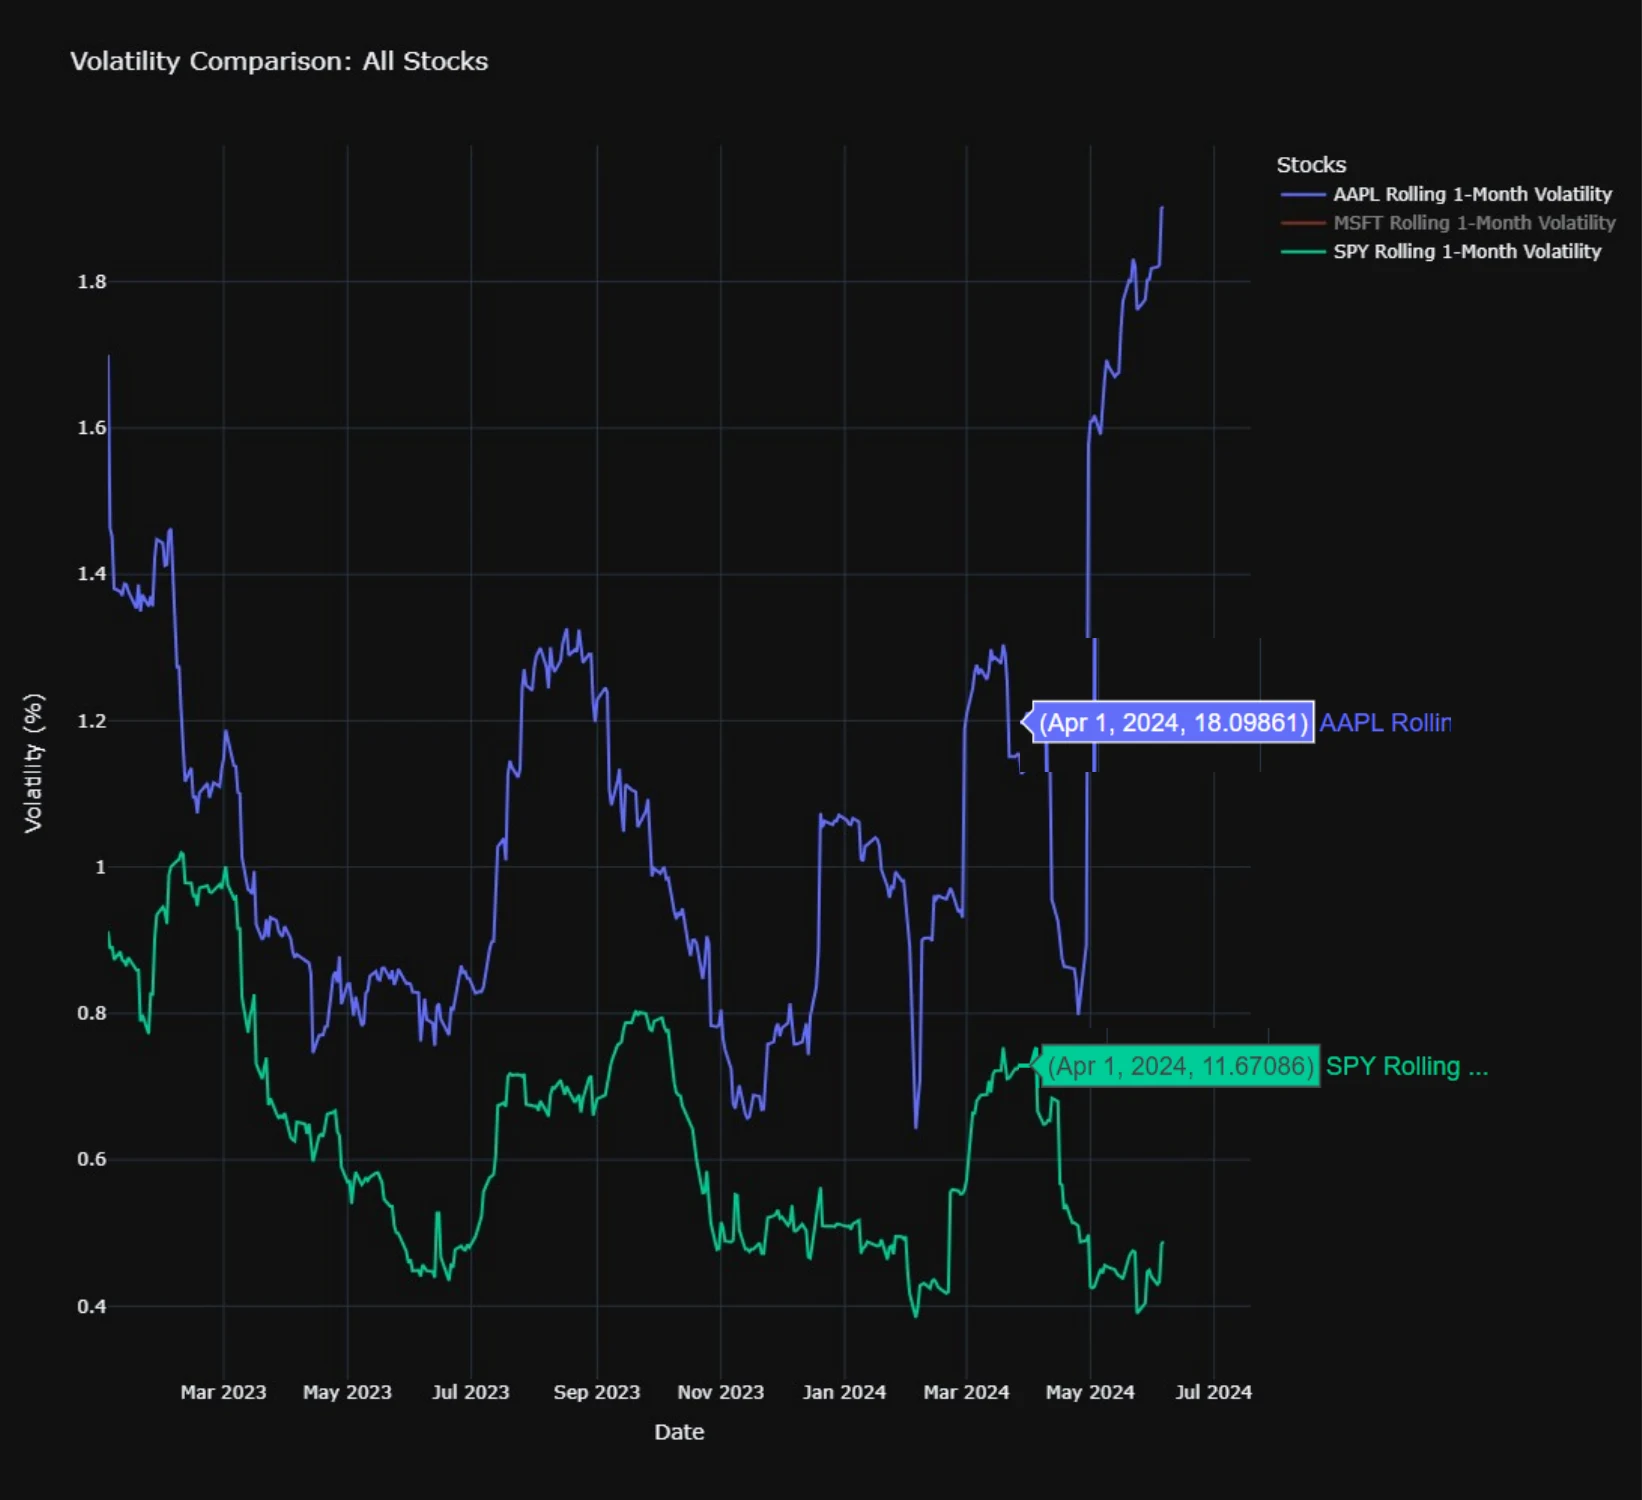
Rolling volatility
30-day rolling volatility, annualized. AAPL stayed above SPY the whole period and spiked sharply in mid-2024.
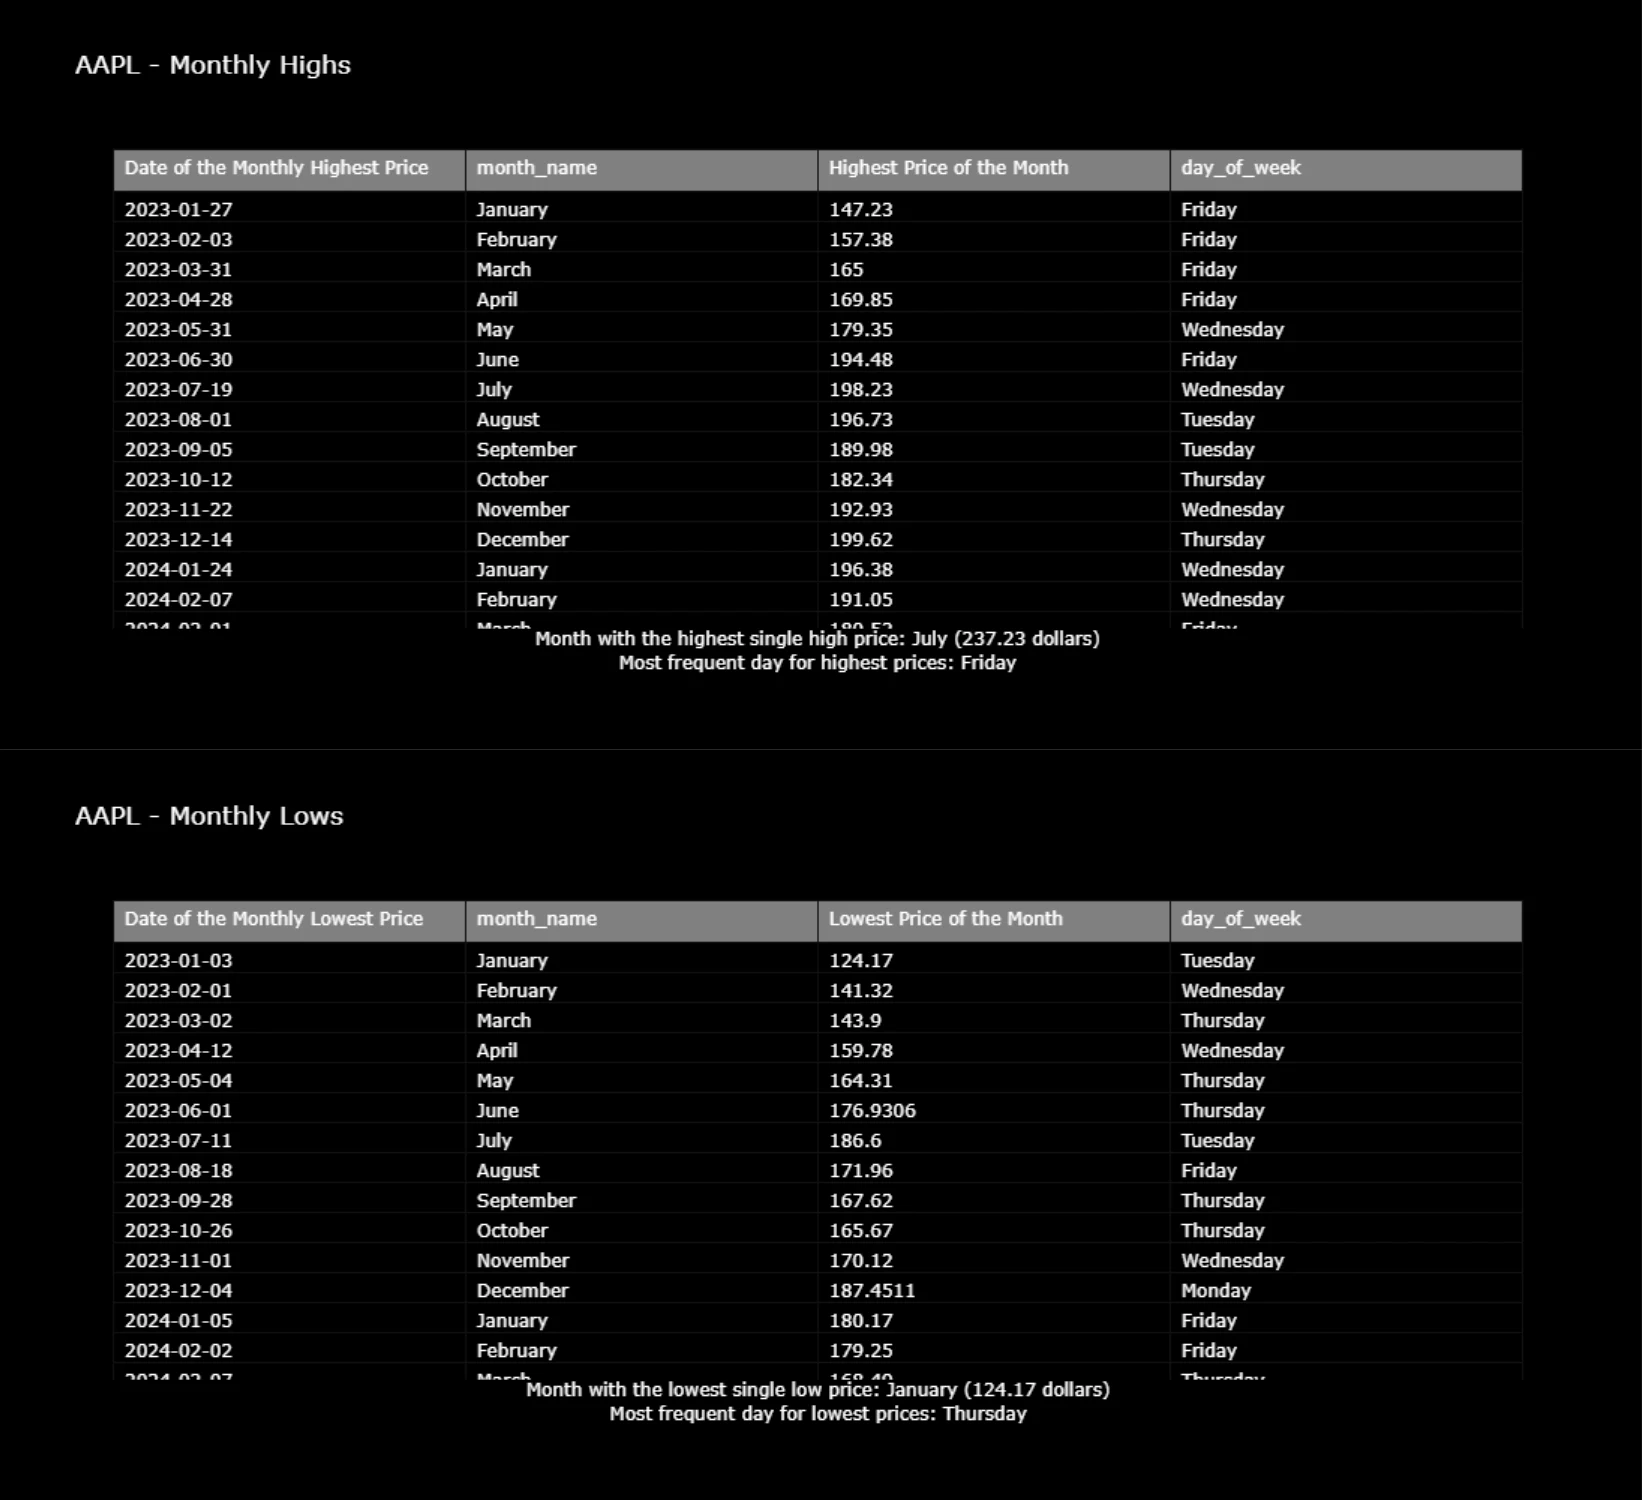
Frequency trends
Monthly highs and lows with the weekday each one landed on. For AAPL, highs most often fell on Fridays and lows on Thursdays.
The Business Question
A startup holding a handful of tech stocks wanted to answer four things quickly: Is the price trending up or down? What did we earn this month? How risky is this stock compared to the market? And is there a pattern in when it peaks and dips? They wanted this from live data, not a spreadsheet someone updates by hand.
The Approach
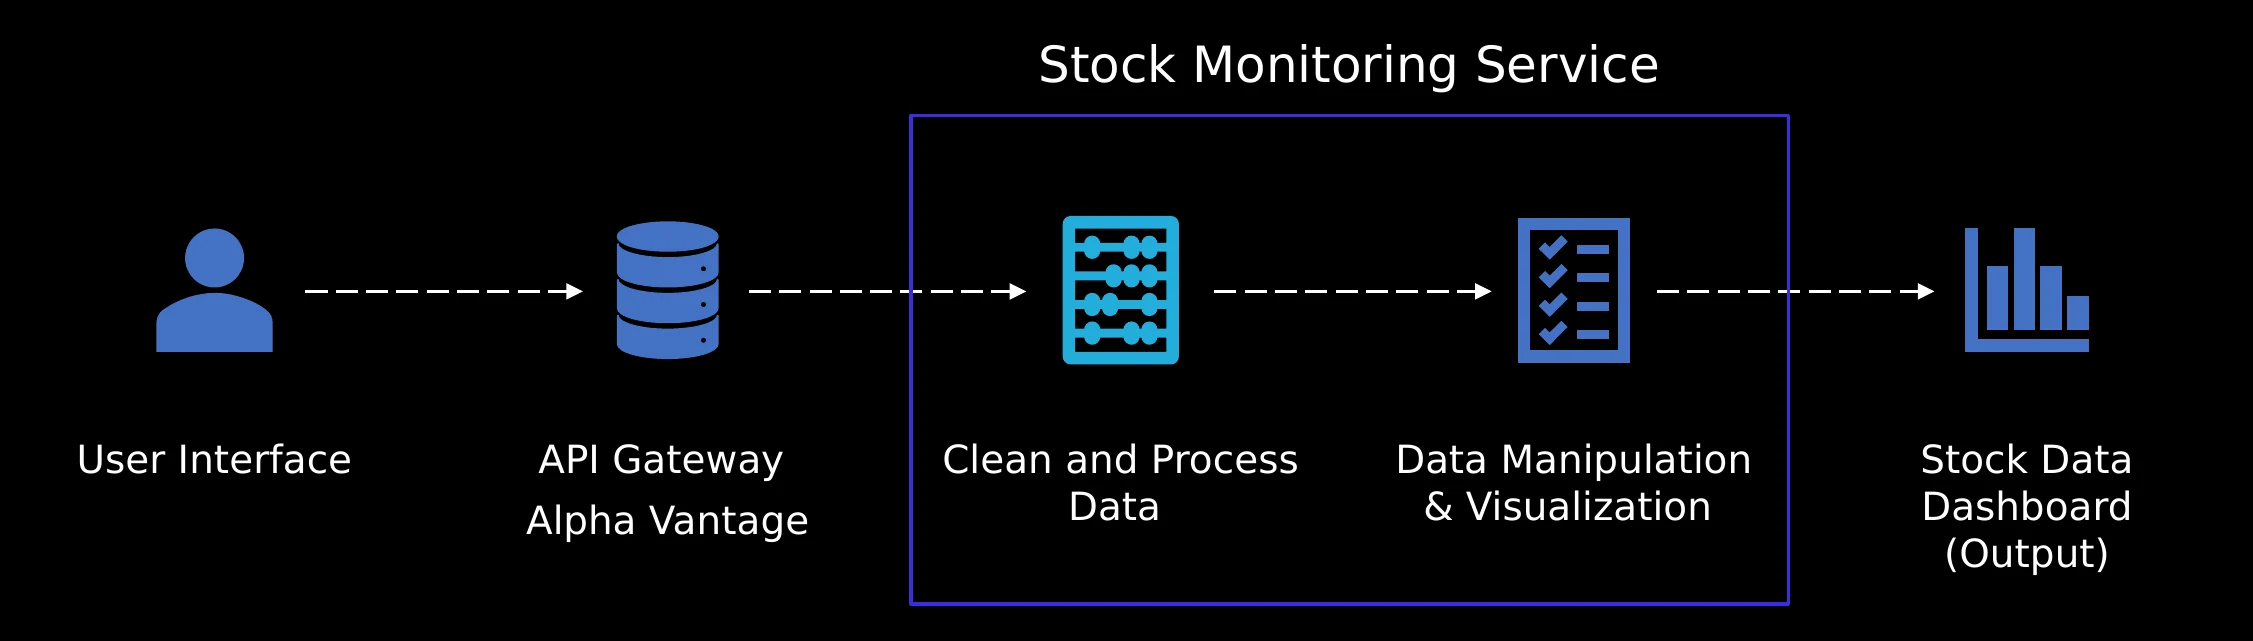
I wrote the technical design document first, then built the pipeline it described. Data comes from Alpha Vantage's daily time series, gets cleaned (column names normalized, duplicates and empty rows removed, date range filtered) and lands in one DataFrame per ticker. From there, six functions produce the analyses: 30-day moving average, monthly average close and volume, daily and monthly ROI, beta against SPY, annualized 30-day rolling volatility, and monthly high/low frequency by weekday. Each function returns a chart or table the UI can drop straight into the window.
- Role
- Technical design, data pipeline, cleaning and all analysis functions
- Team
- Pitchaporn Keenaphan (UI/UX)
- Timeline
- Jul–Aug 2024
What Each Number Tells an Investor
Six analyses, one pipeline
Every analysis in the tool answers a specific question an investor would ask. The moving average shows direction. ROI shows what a position actually returned. Beta and rolling volatility show risk relative to the market. Frequency trends show whether there's any pattern in timing.
None of these are trading signals on their own. The tool's job is to put them side by side so a person can make the call with the full picture.
The Numbers Behind the Analysis
- Moving average and rolling volatility window
- 30 daysMoving average and rolling volatility window
- Annualization factor — trading days in a year
- √252Annualization factor — trading days in a year
- Data window analysed: Jan 2023 – Jul 2024
- 19 monthsData window analysed: Jan 2023 – Jul 2024
- Tickers per query — any two stocks plus SPY as the market benchmark
- 3Tickers per query — any two stocks plus SPY as the market benchmark
Technical Foundation
Python
pandas and NumPy for the pipeline and all calculations; Matplotlib for charts.
Alpha Vantage API
Daily time-series data pulled fresh per ticker on every run and held in memory — no database.
Data cleaning
Normalized column names, removed duplicates and empty rows, filtered to the requested date range, aligned series before any cross-ticker calculation.
Financial analysis
Moving average, ROI, beta, annualized rolling volatility, monthly high/low frequency.
Technical design
Wrote the TDD: architecture, data flow, and the input/output contract for each stage.