Work
Seven projects across product, data, and engineering — each one a story, not a repo.

When Women Rise: At What Age Do Women Reach Leadership?
A SQL study of 24,000 leadership records from Wikidata: at what age women reach the top, and how that compares with men.
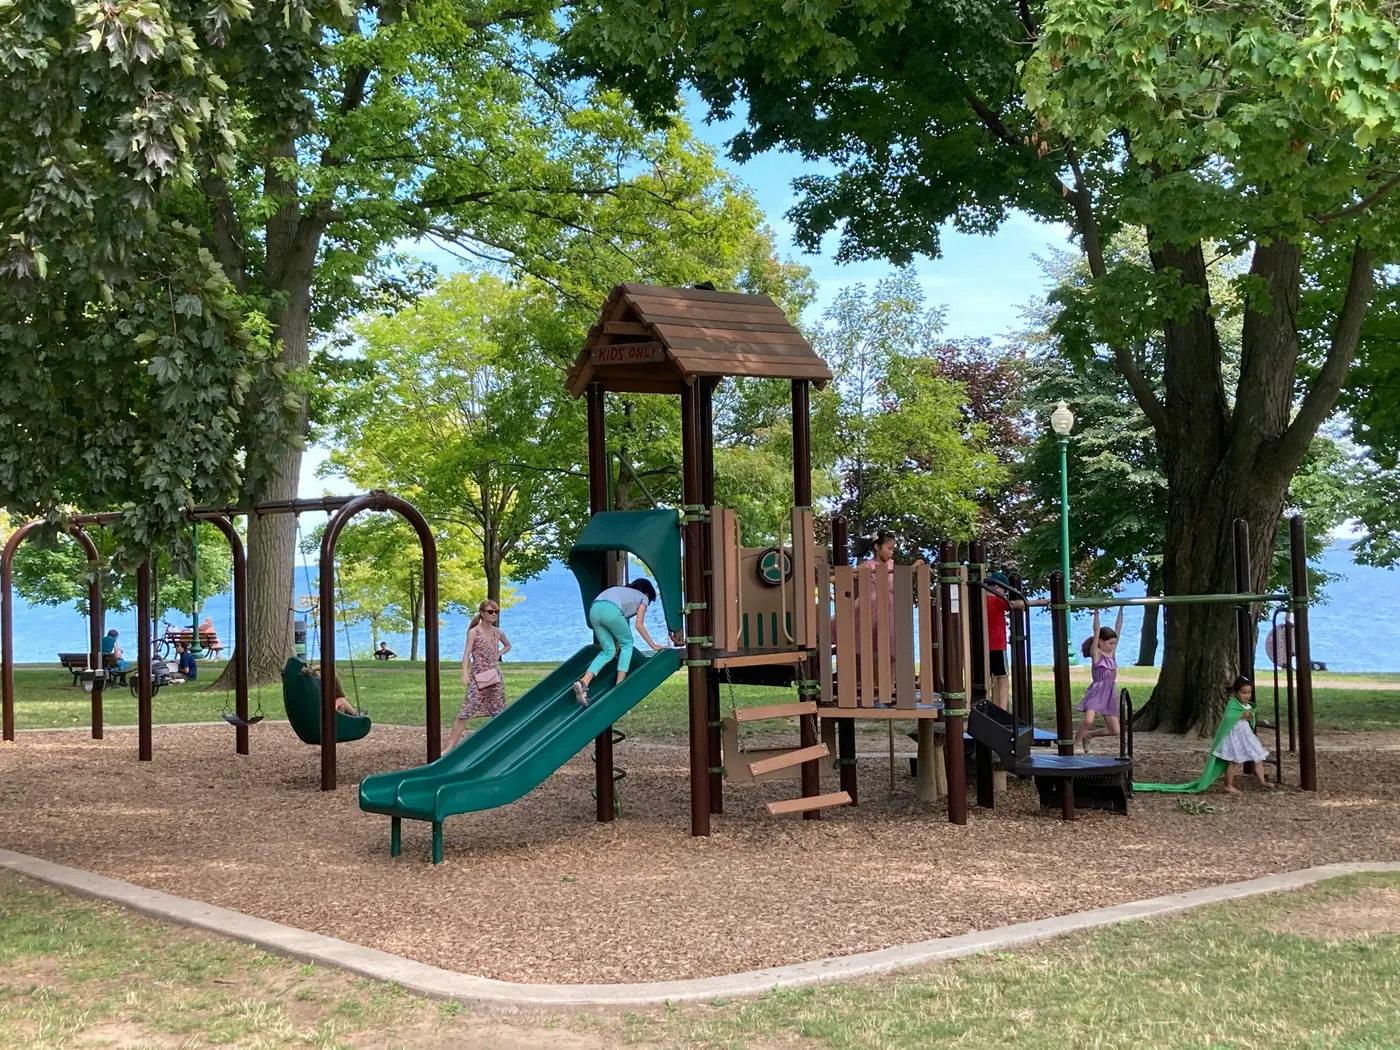
Ontario Playground Finder
A community-built map of Ontario playgrounds — filter by age group, equipment, surface and amenities before you leave the house.
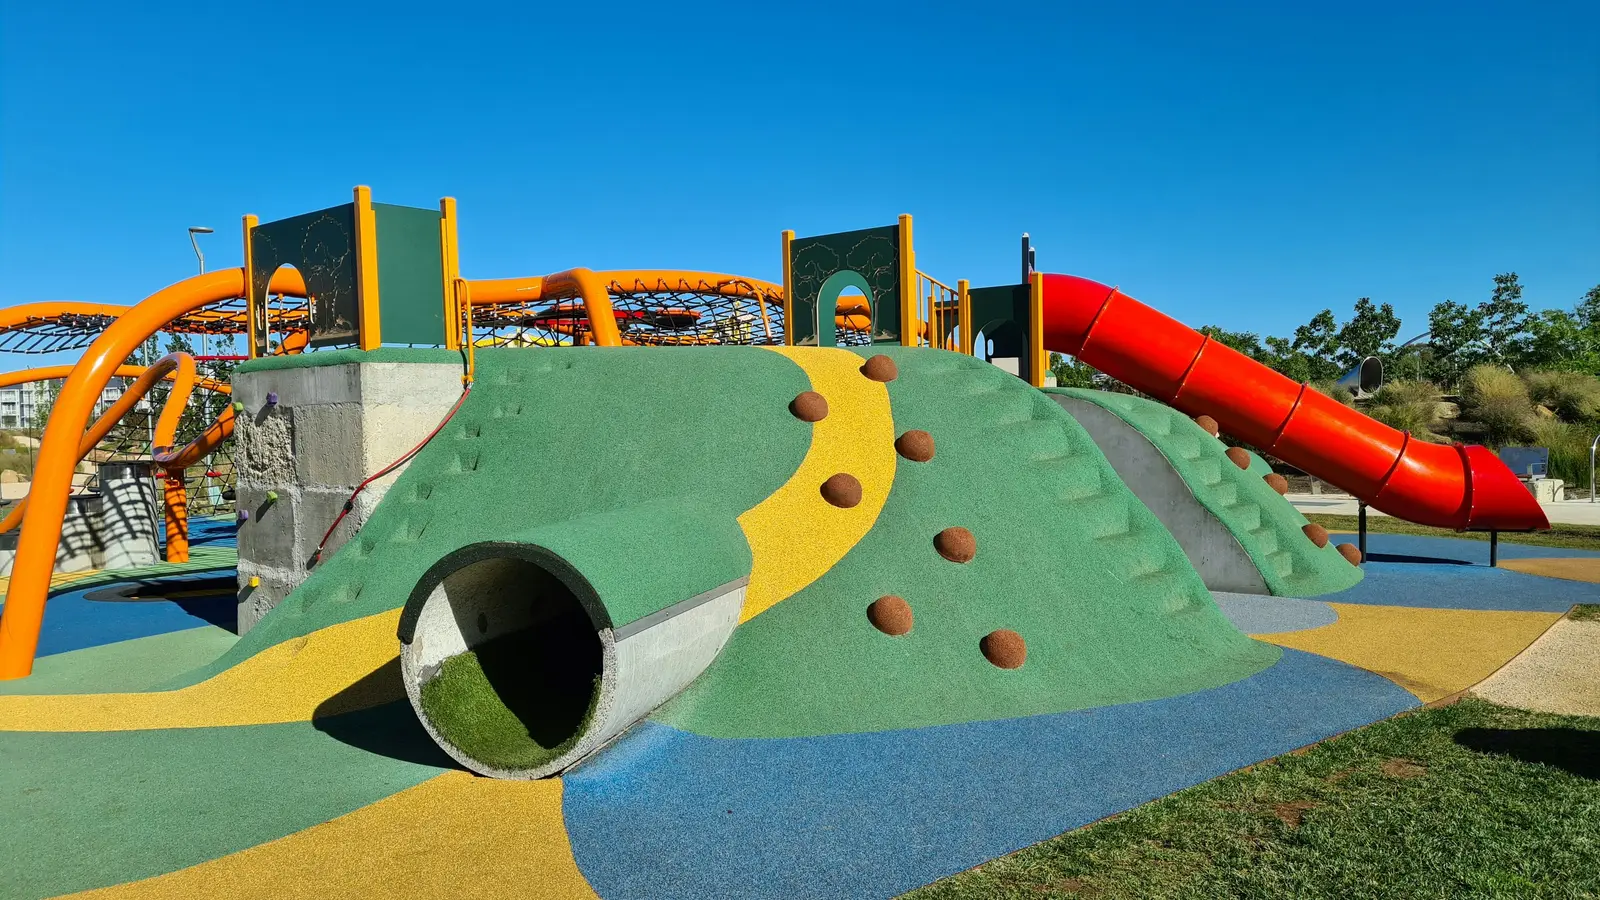
Ontario Playground Map on ArcGIS
Survey123, ArcGIS Dashboards and StoryMaps chained into one pipeline — community-collected playground data, live on a public map, built without a line of backend code.
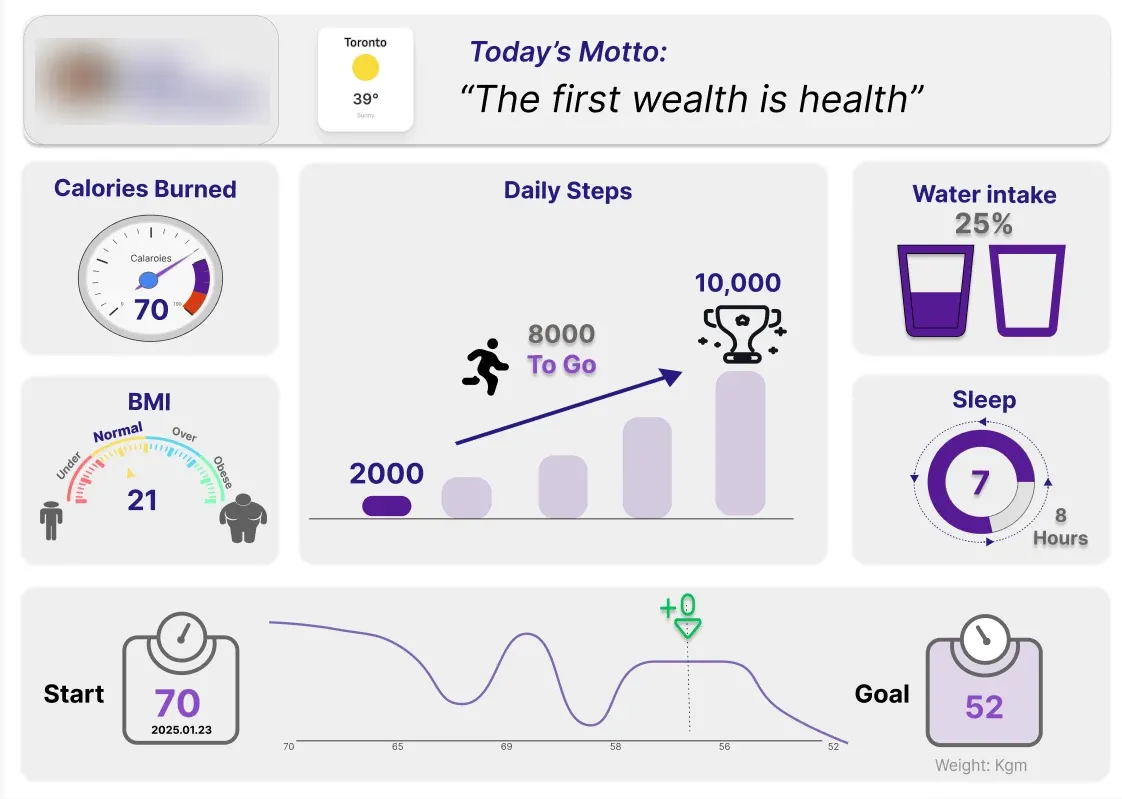
Health Tracking Dashboard: Designing Around One Person's Morning
A user-centred design project — one interview, two sketches, a Figma prototype and a Tableau dashboard built for how a real person actually checks her health each morning.
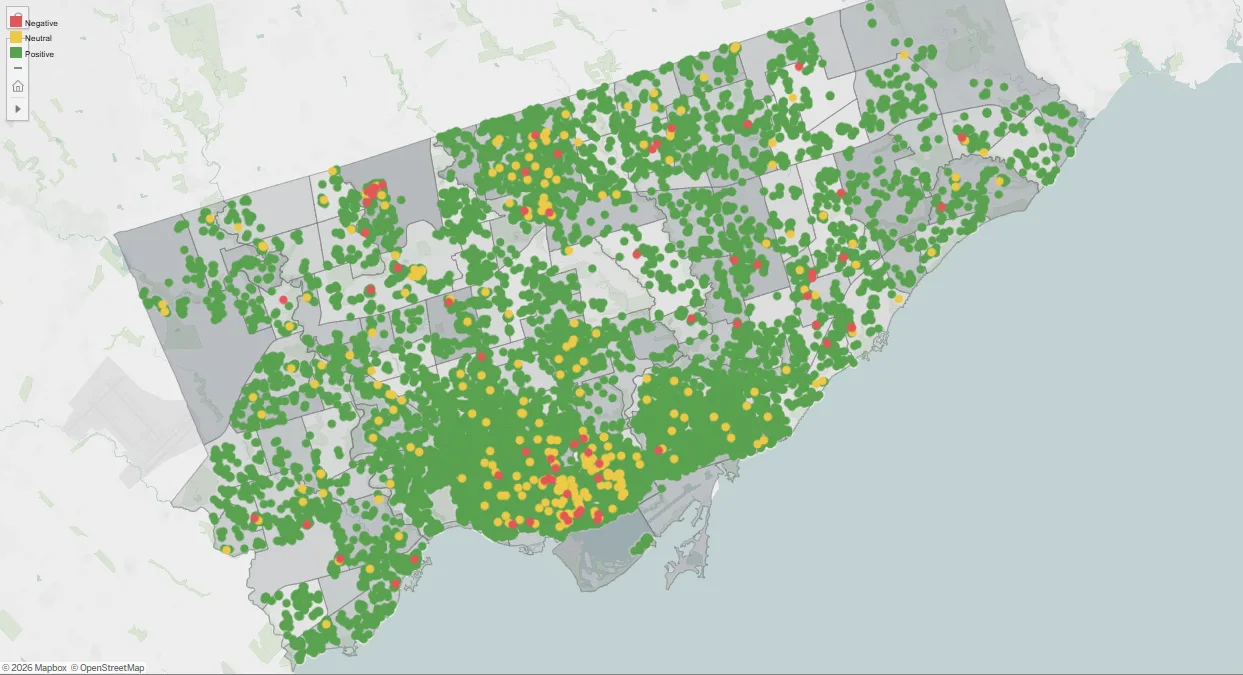
Airbnb in Canada: What Guest Reviews Say About Where People Stay
A three-part Tableau story on Canadian Airbnb listings and reviews — I led the team, sourced and joined the data, and built the review-sentiment analysis in Python.
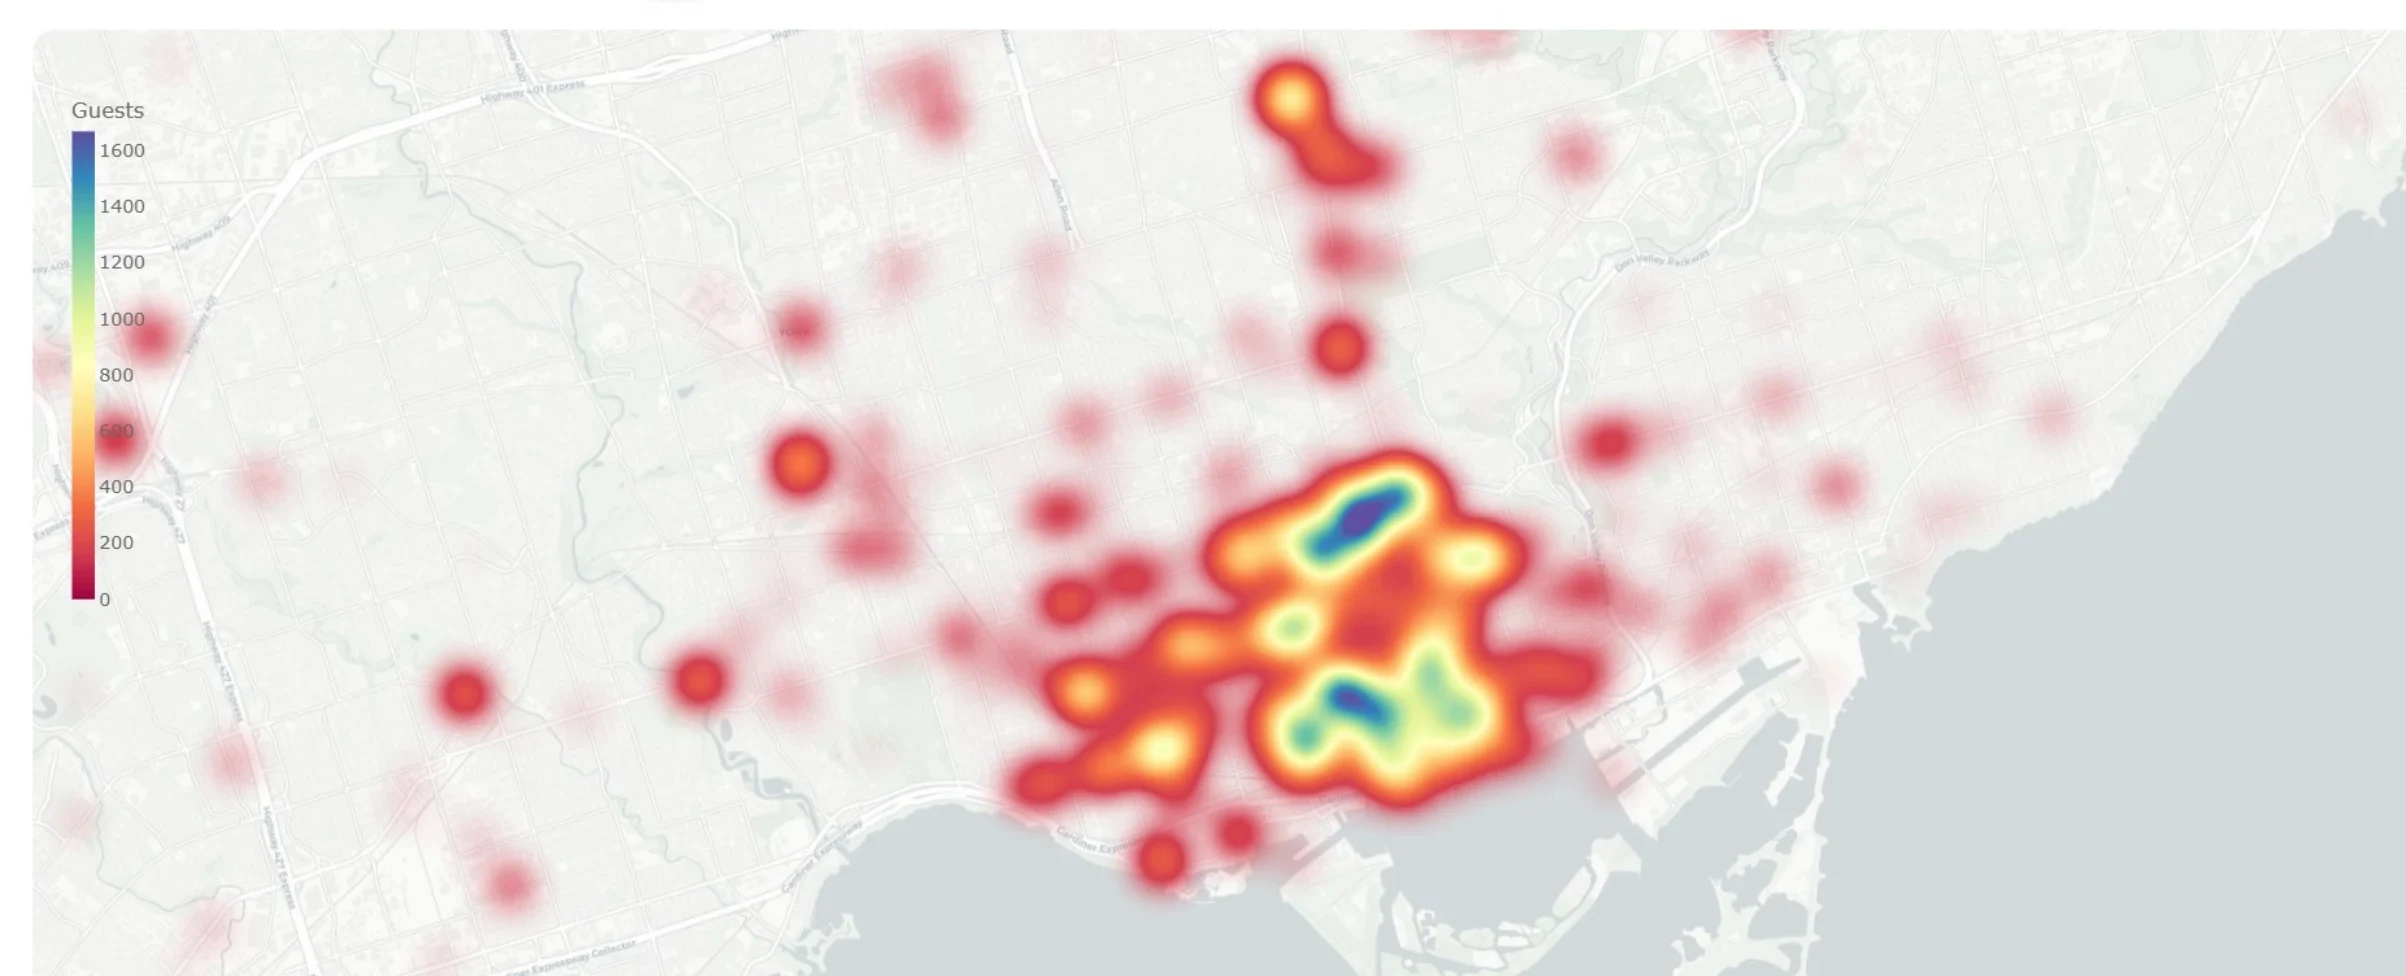
PopIn: Building an Event Data Pipeline for the GTA From Scratch
Capstone with a Toronto event-tech startup: daily public event data collection, 52 categories unified into 13, and a heatmap dashboard with attendance forecasting.

Startup Success Prediction: What Actually Drives an Acquisition
A statistical study of 916 US startups testing common founder assumptions against real outcomes — what actually predicts getting acquired instead of shutting down.

InvestInsight: A Python Tool for Watching Tech Stocks Against the Market
A desktop stock-analysis tool built on the Alpha Vantage API — moving averages, returns, beta, rolling volatility and price-timing patterns for AAPL, MSFT and SPY.