
3.3x
Companies that raised a Series D round were 3.3x more likely to be acquired
~5x
Startups recognized on a top-500 list were about 5x more likely to be acquired
0.65
Seven measurable factors together explain about two-thirds of why some startups raise more funding than others
1.4x
Startups that relied only on angel funding, with no later rounds, were about 1.4x more likely to close than to be acquired
What the data actually shows
Three findings that translate directly into business decisions.
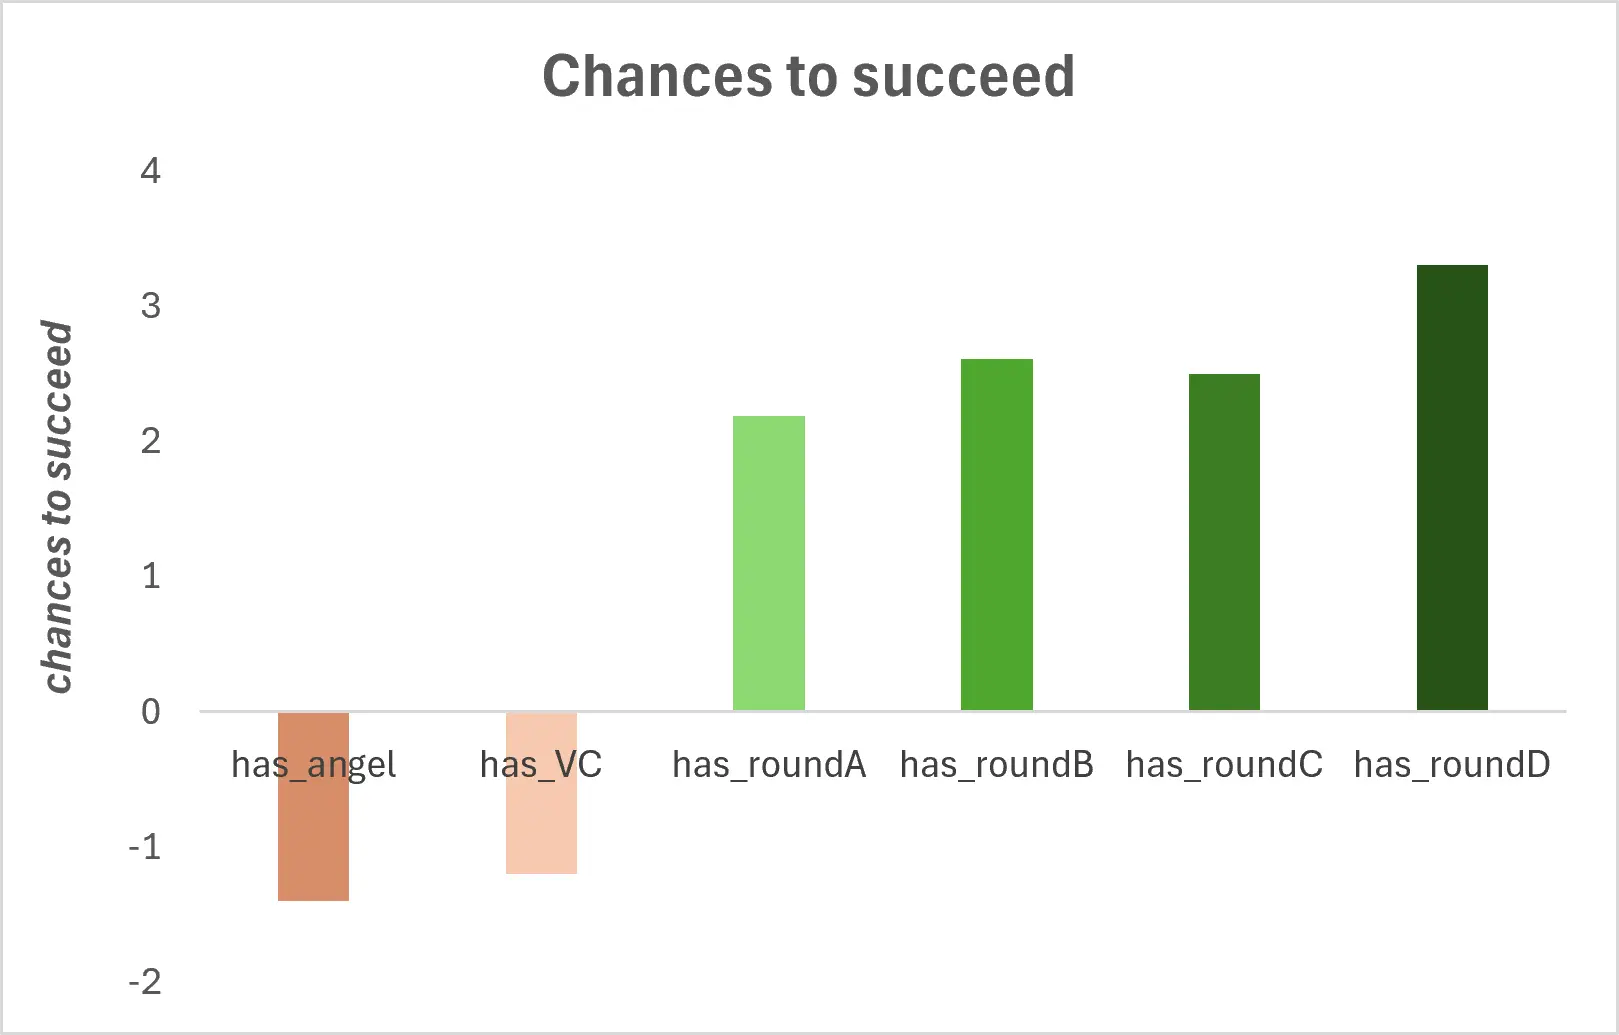
Later rounds, better odds
Odds of acquisition climb through round A (2.2x) to round D (3.3x) — while relying only on angel or VC money leaned the other way.
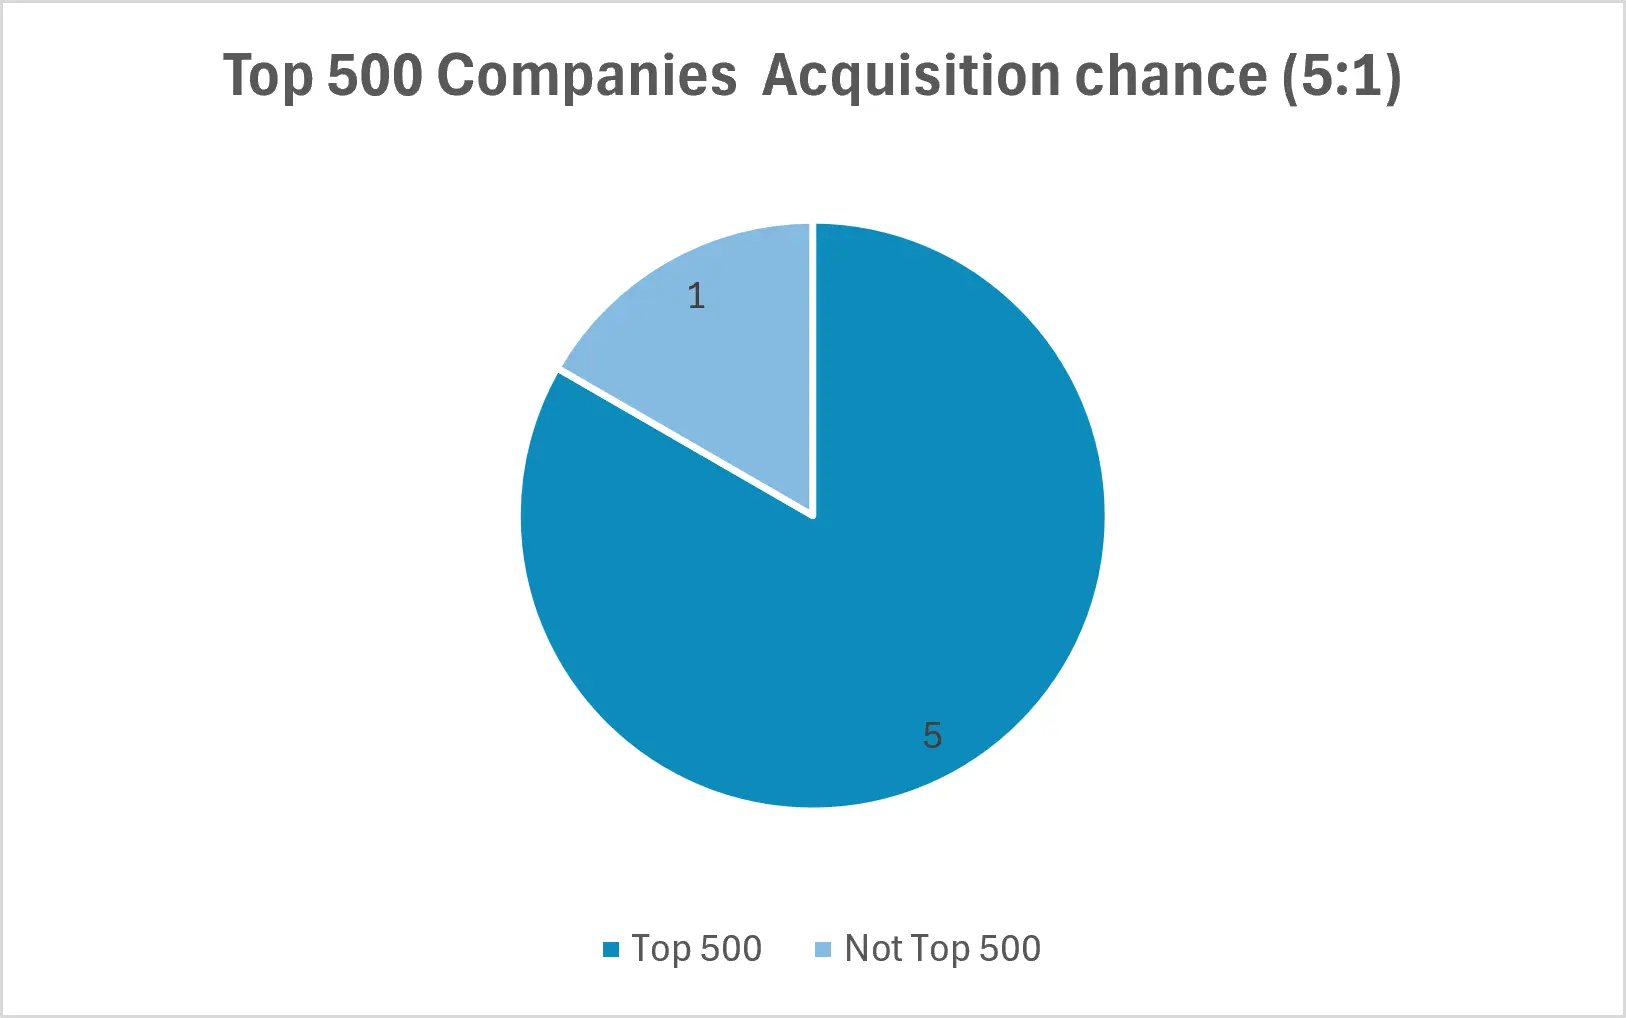
Top-500 recognition matters
Startups on a top-500 list were about 5x more likely to be acquired.
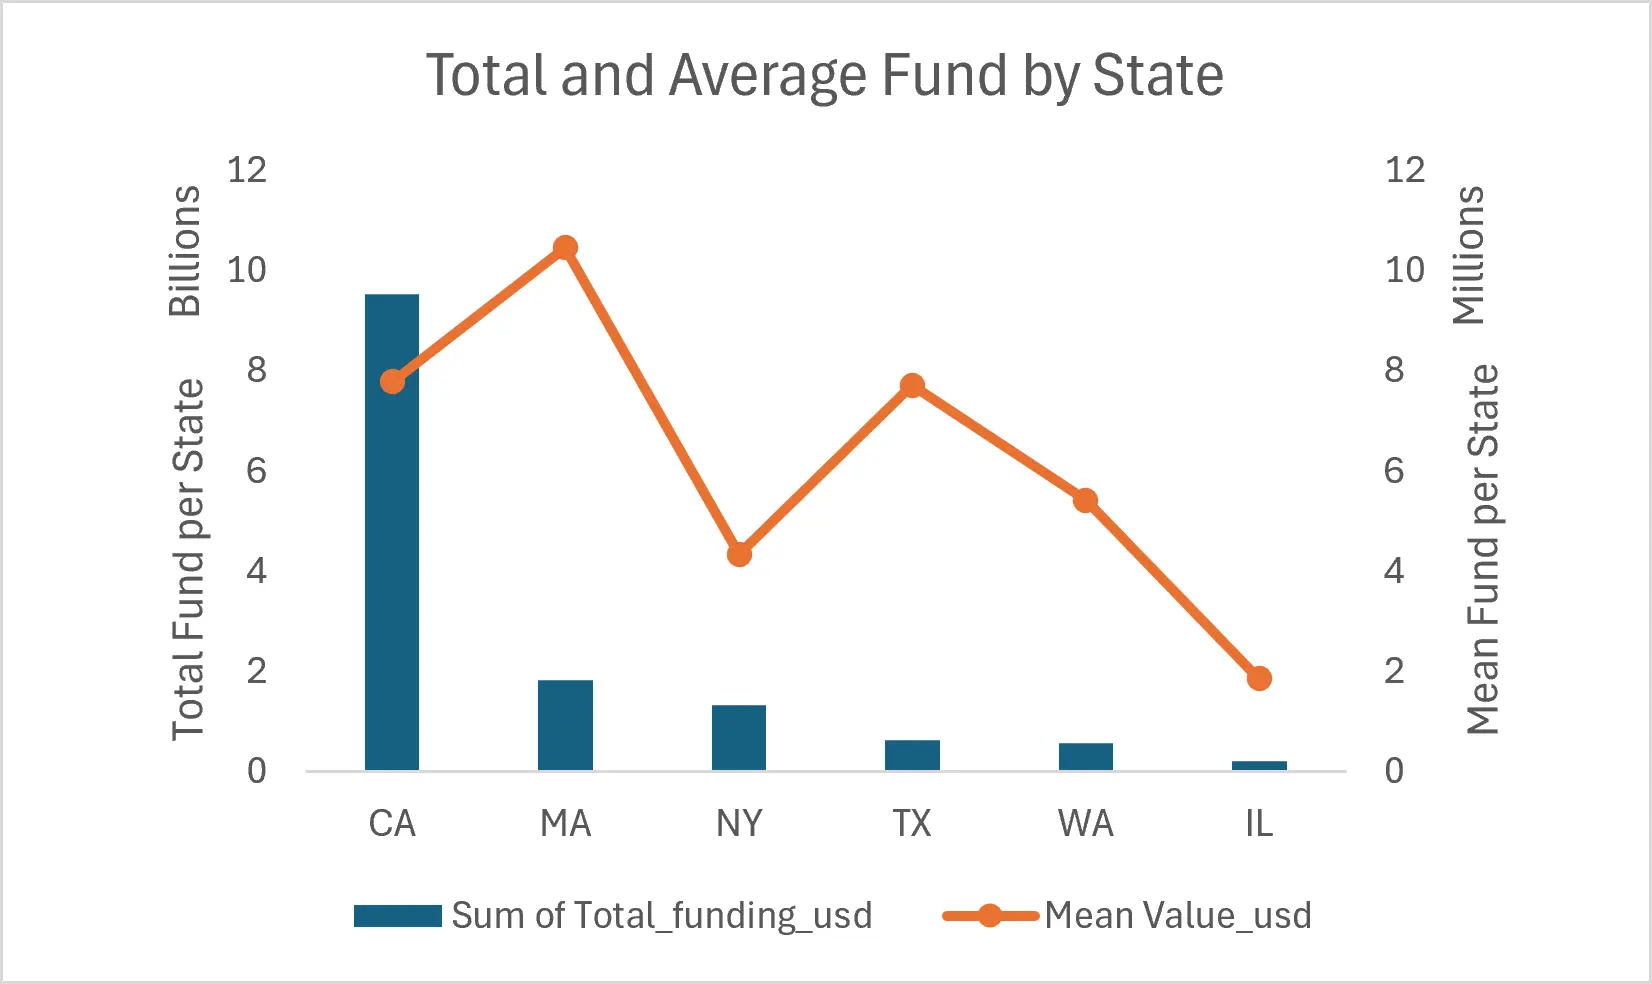
Location moves the number
California leads on total funding raised; Massachusetts leads on average funding per company.
The Business Question
Two questions drove this study: what predicts whether a startup gets acquired instead of closing, and — since funding turned out to matter — what predicts how much money a startup raises in the first place. I also tested whether industry and location move the odds either way.
The Approach
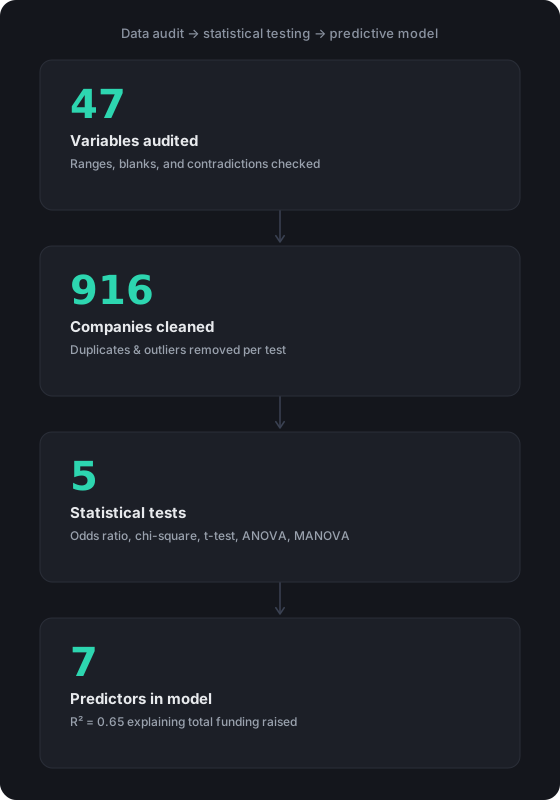
I audited all 47 variables (factors) in a public dataset for range errors, contradictions, and undocumented fields, then matched each business question to the right statistical test: odds ratios for funding-round effects, chi-square for industry and state effects, t-tests and ANOVA for funding differences, and a 7-factor regression model to explain total funding raised. The seven factors: how long the company had been raising money, how many investors typically joined each round, total funding rounds completed, number of strong industry relationships, top-500 recognition, angel-only funding, and VC backing.
- Role
- Sole analyst — data audit, cleaning strategy, statistical testing, and regression modeling
- Team
- Solo
- Timeline
- Sep 2024
How Much More Money Can You Actually Raise?
Seven measurable factors
Once a startup is raising money, the amount it ends up with isn't random — a regression model on this dataset isolates exactly which factors move that number, and by how much.
The single biggest lever wasn't networking or media recognition. It was whether a company relied on angel funding alone, with no later rounds — that one factor outweighed everything else in the model combined.
The 7 Factors Behind Funding
- Angel funding only, no later rounds
- 84.5% less Angel funding only, no later rounds
- Top-500 recognition
- 30% more Top-500 recognition
- Each additional funding round
- 18% more Each additional funding round
- VC backing
- 10% less VC backing
- Each additional year to last funding
- 6% more Each additional year to last funding
- Each additional investor per round, on average
- 6% more Each additional investor per round, on average
- Each additional strong industry relationship
- 1.6% more Each additional strong industry relationship
Technical Foundation
-
Excel
Full statistical battery: odds ratios, chi-square, t-tests, ANOVA, MANOVA, regression — 30 reproducible sheets.
-
Data cleaning
Range audit, external verification of contradictory dates, explicit placeholder coding for missing values.
-
Regression
Built and validated the 7-predictor model explaining 65% of total funding raised.
-
Exploratory Data Analysis (EDA)
Checked skew, outliers, and distribution shape on every variable before running any test.
-
Hypothesis Testing
Matched each business question to the right test — odds ratios, chi-square, t-tests, ANOVA, MANOVA — and validated assumptions before trusting the results.