1.9M
Reviews on record across listings in Ontario, Quebec, BC, New Brunswick and Manitoba
49K+
Listings in the joined dataset — about half of them in Ontario, 21,660 in Toronto alone
97.6%
Of reviewed listings read as positive overall; under 1% negative
54
Average reviews per listing in BC — the highest in Canada, against 30 in Ontario
The review chapter
The three dashboards I built on the review data: where the reviews are, what they say, and how that plays out in Toronto.
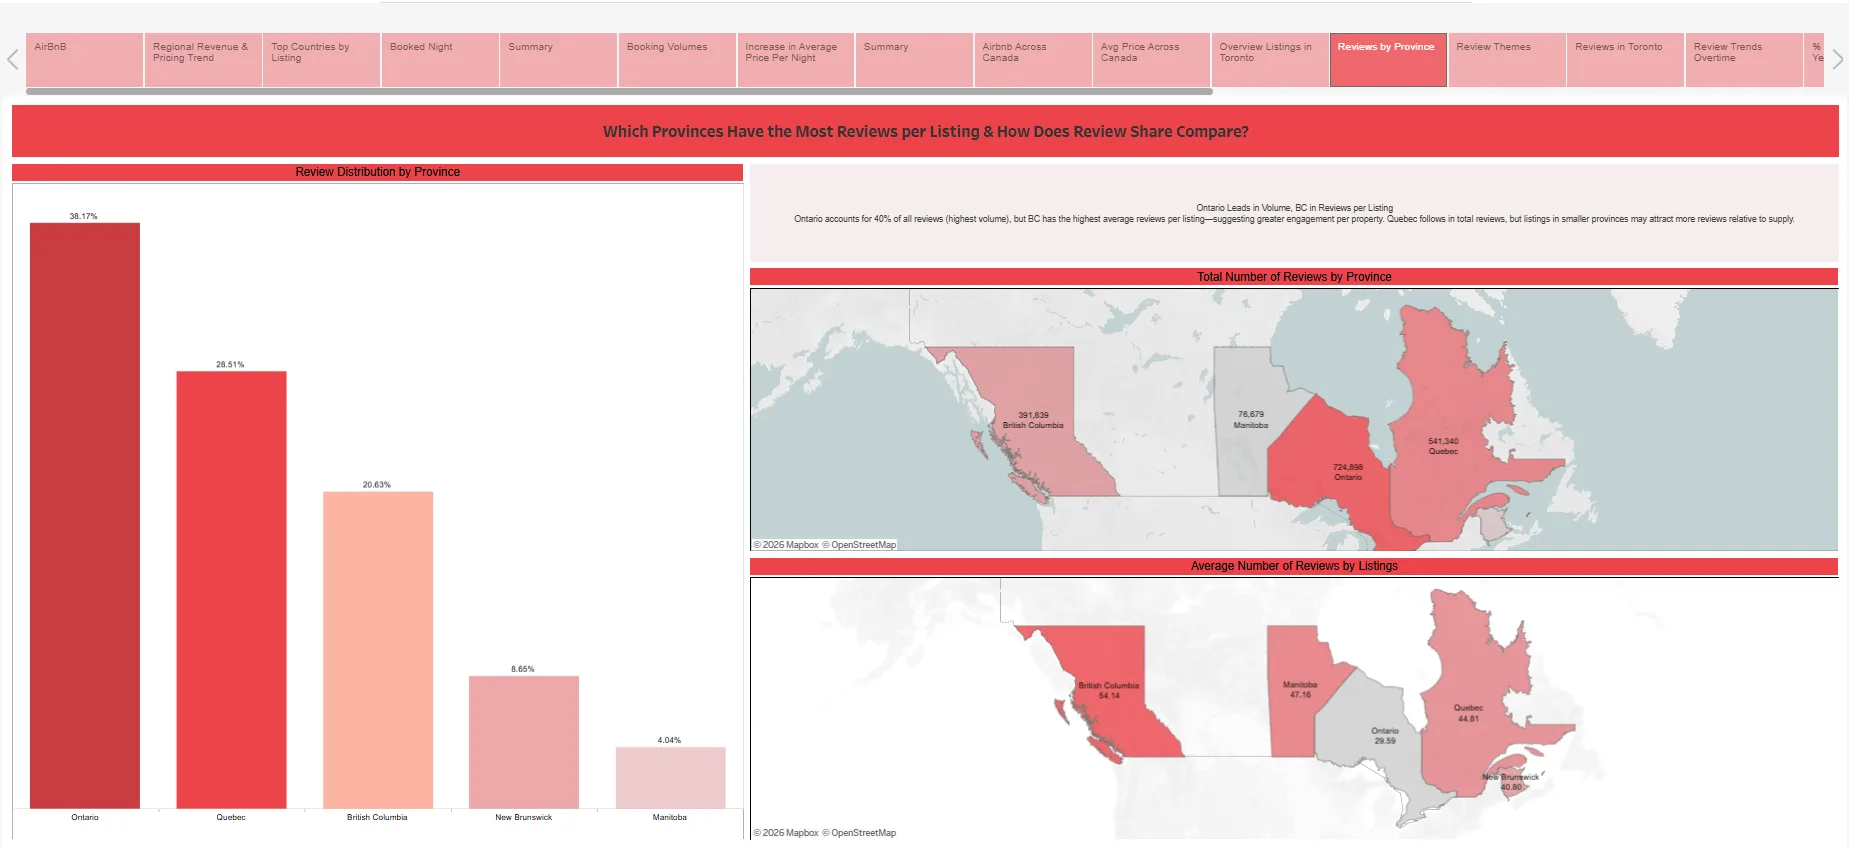
Reviews by province
Ontario has 38% of all reviews by volume, but BC gets the most reviews per listing. Volume follows supply; engagement doesn't.
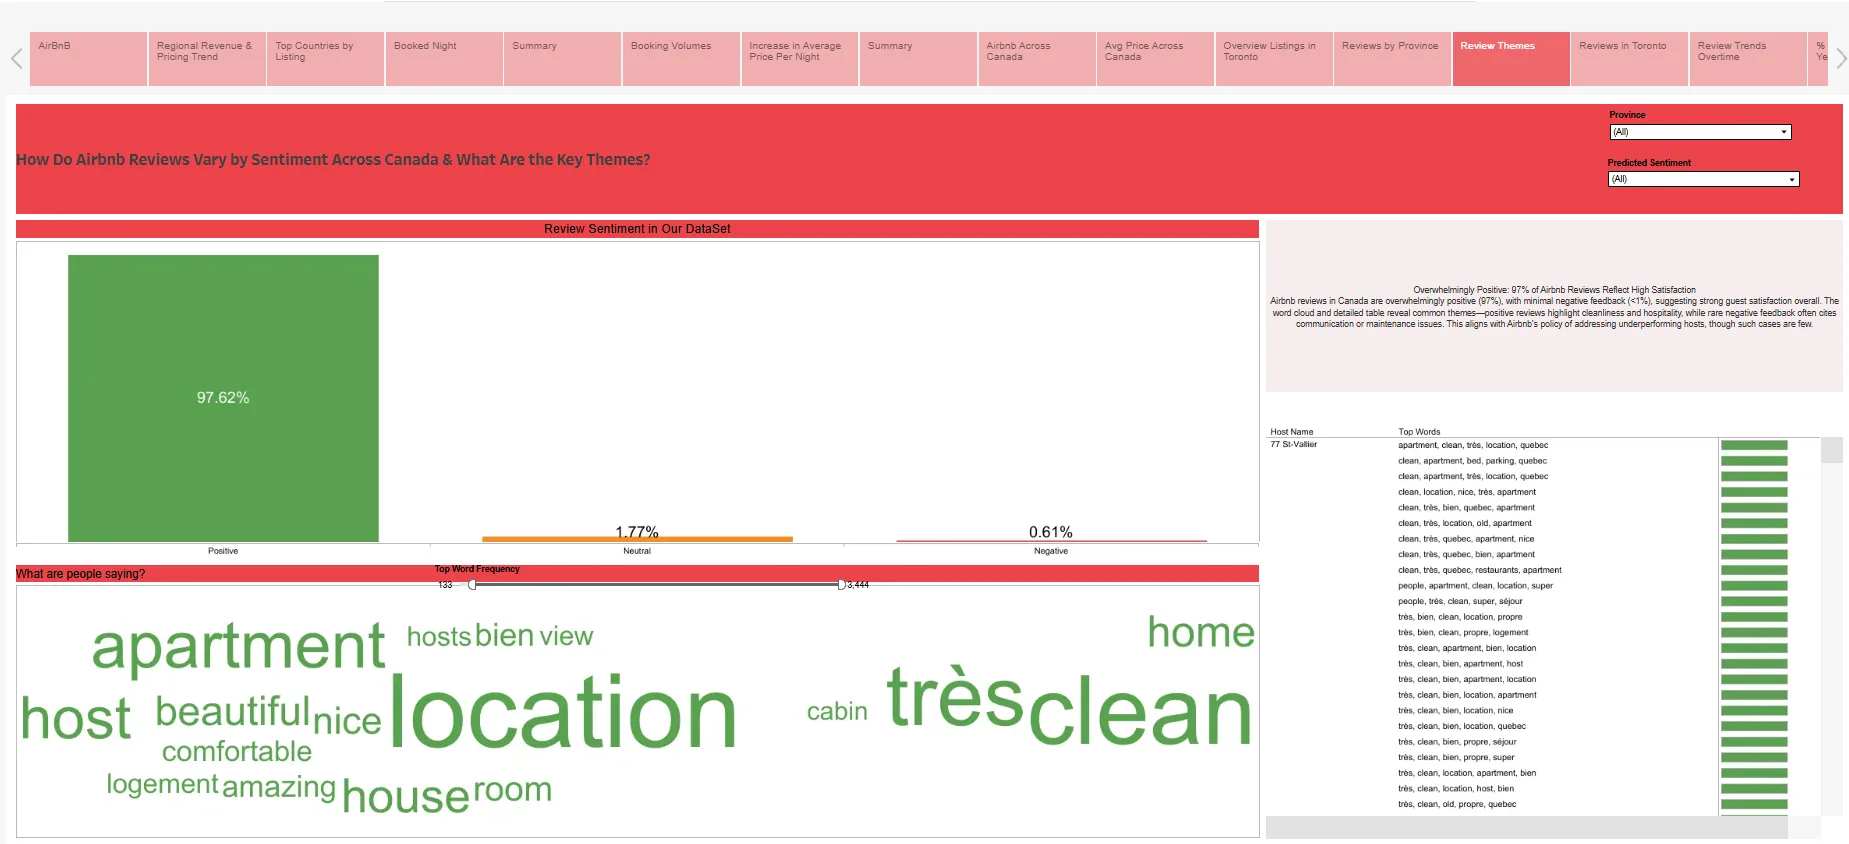
Review sentiment and themes
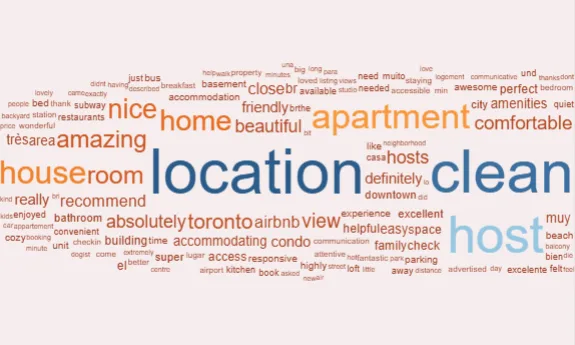
TextBlob polarity on each listing's combined reviews, plus its five most frequent words with English and French stop words removed. 'Clean', 'location' and 'host' dominate.
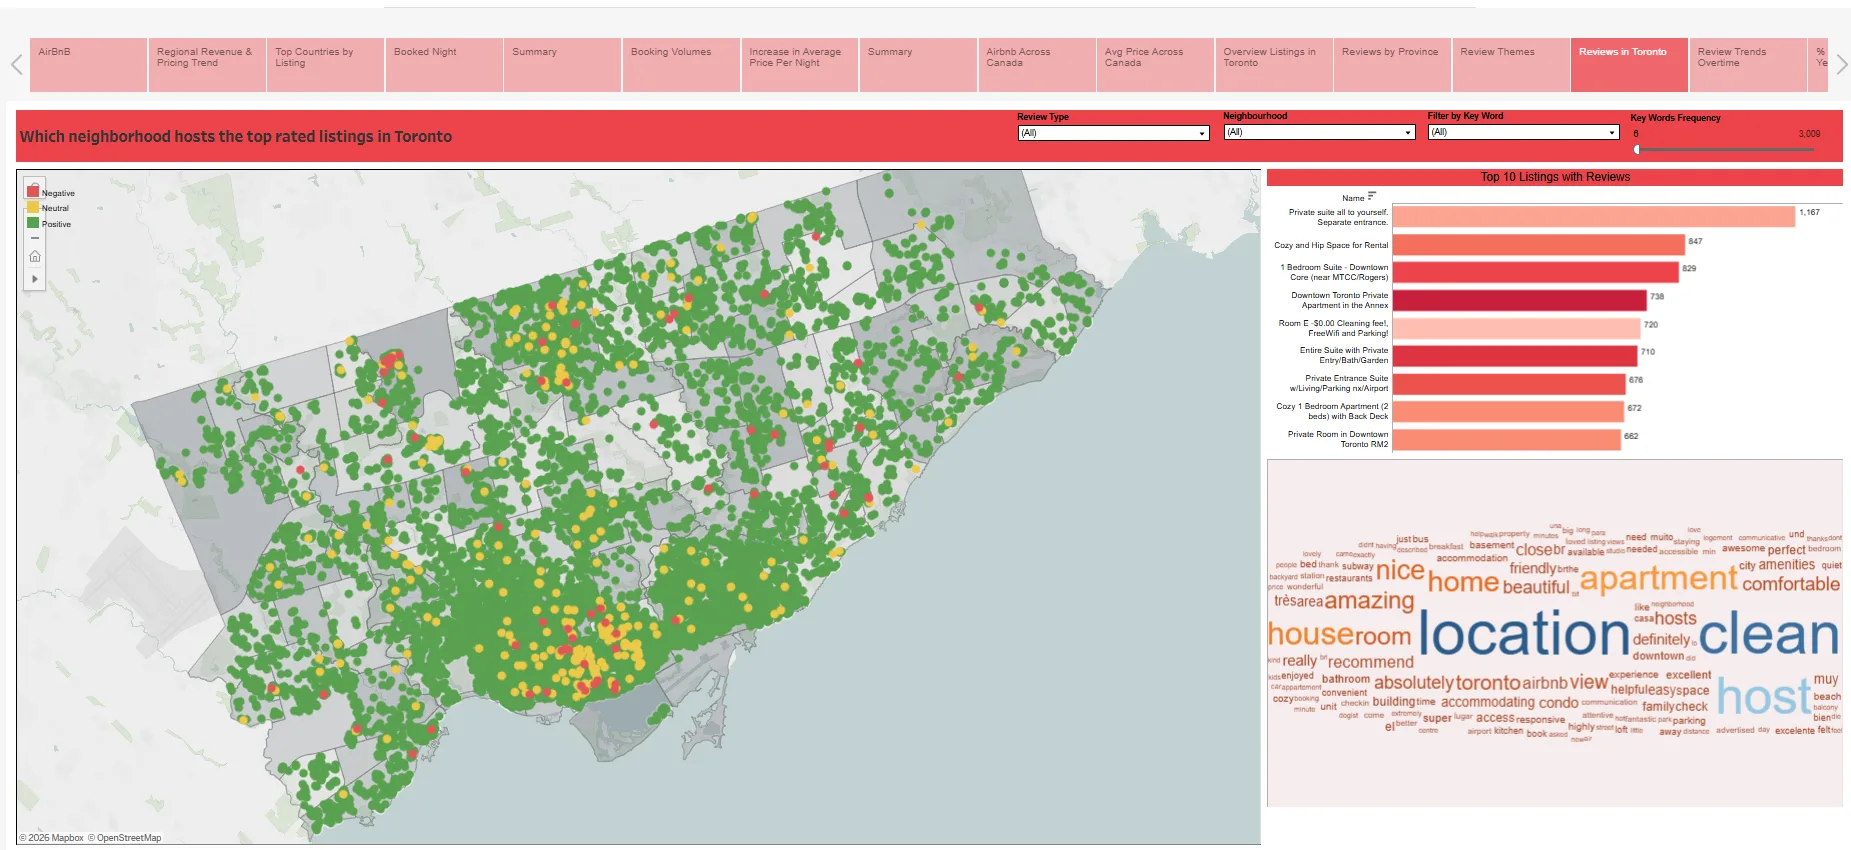
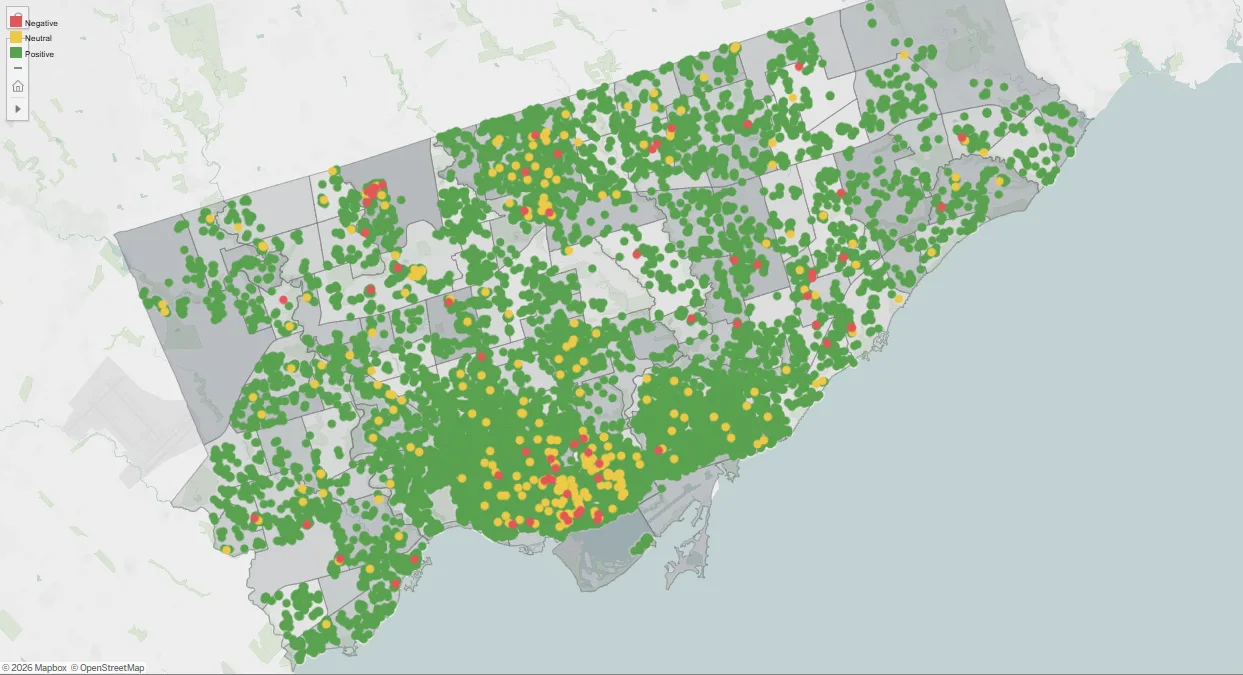
Sentiment across Toronto
Every reviewed listing in Toronto, coloured by sentiment. Negative reviews cluster downtown where density is highest, not in any one neighbourhood.
Two files that didn't fit together
The listings data and the reviews data came as separate files with no guarantee they'd match. Not every listing had reviews, and the reviews were a mix of English and French with no language flag. Meanwhile, four people needed to work in parallel on the same dataset without producing four disconnected dashboards.
One story, four chapters, one join
I joined the two files on listing ID and kept only listings with at least one review for the review analysis — the rest stayed in for pricing and supply. Then I set the narrative before anyone opened Tableau: global market first (revenue, pricing, top countries), then Canada (supply by province, prices by room type, Toronto in depth), then the guest voice (sentiment, themes, trends over time, loyalty). Each teammate owned one section and one question; I owned the review analysis and the final story assembly. For the reviews, I combined each listing's comments into one text, cleaned it, ran TextBlob polarity to classify the listing as positive, neutral or negative, and used CountVectorizer with combined English and French stop lists to pull its five most frequent words. The output joined back to Tableau as a sentiment and top-words table per listing.
- Role
- Team lead — story design, data sourcing and join, review sentiment and themes, three dashboards
- Team
- Manuel Marroquin-Ramirez, Pitchaporn Keenaphan, Toluwalope Oluyipe
- Timeline
- Spring 2025
Leading Without Doing Everything
Four analysts, one narrative
The hard part of a team analytics project isn't the analysis. It's making four people's work read as one argument. I did that by fixing the story structure first — three chapters, each answering one question — and giving each person a chapter with a clear question to answer, not a dataset to explore.
My own chapter was the one that needed code. Listings data is easy to chart; review text isn't. Taking that piece myself meant the team could stay in Tableau while the NLP happened in Python, and the results came back as a clean table anyone could use.
The Numbers Behind the Analysis
- Source files joined: listings and reviews, on listing ID
- 2Source files joined: listings and reviews, on listing ID
- Top words extracted per listing from its combined reviews, with English and French stop words removed
- 5Top words extracted per listing from its combined reviews, with English and French stop words removed
- Sentiment classes from TextBlob polarity: positive above 0.1, negative below −0.03, neutral between
- 3Sentiment classes from TextBlob polarity: positive above 0.1, negative below −0.03, neutral between
- Story pages across three chapters
- 19Story pages across three chapters
Technical Foundation
Data sourcing
Airbnb listings and reviews from Maven Analytics; joined on listing ID, filtered to reviewed listings for the text analysis.
Python
pandas for cleaning and joining; scikit-learn CountVectorizer for top words; TextBlob for sentiment; NLTK for French stop words.
Tableau
Three dashboards on the review data, plus assembly of the 19-page story from all four teammates' work.
Story design
Defined the three-chapter arc and one question per page before analysis started.
Team lead
Split the work by question, not by dataset; reviewed each section for fit with the narrative.