~2,000
Events collected per day at full run, in under 90 minutes across all sources
52 → 13
Raw category labels unified into 13 general categories and 22 sub-categories
40%
Variance in attendance explained by the forecasting model (R²)
What we delivered
A web app with three views on the data, and the pipeline that keeps it current.
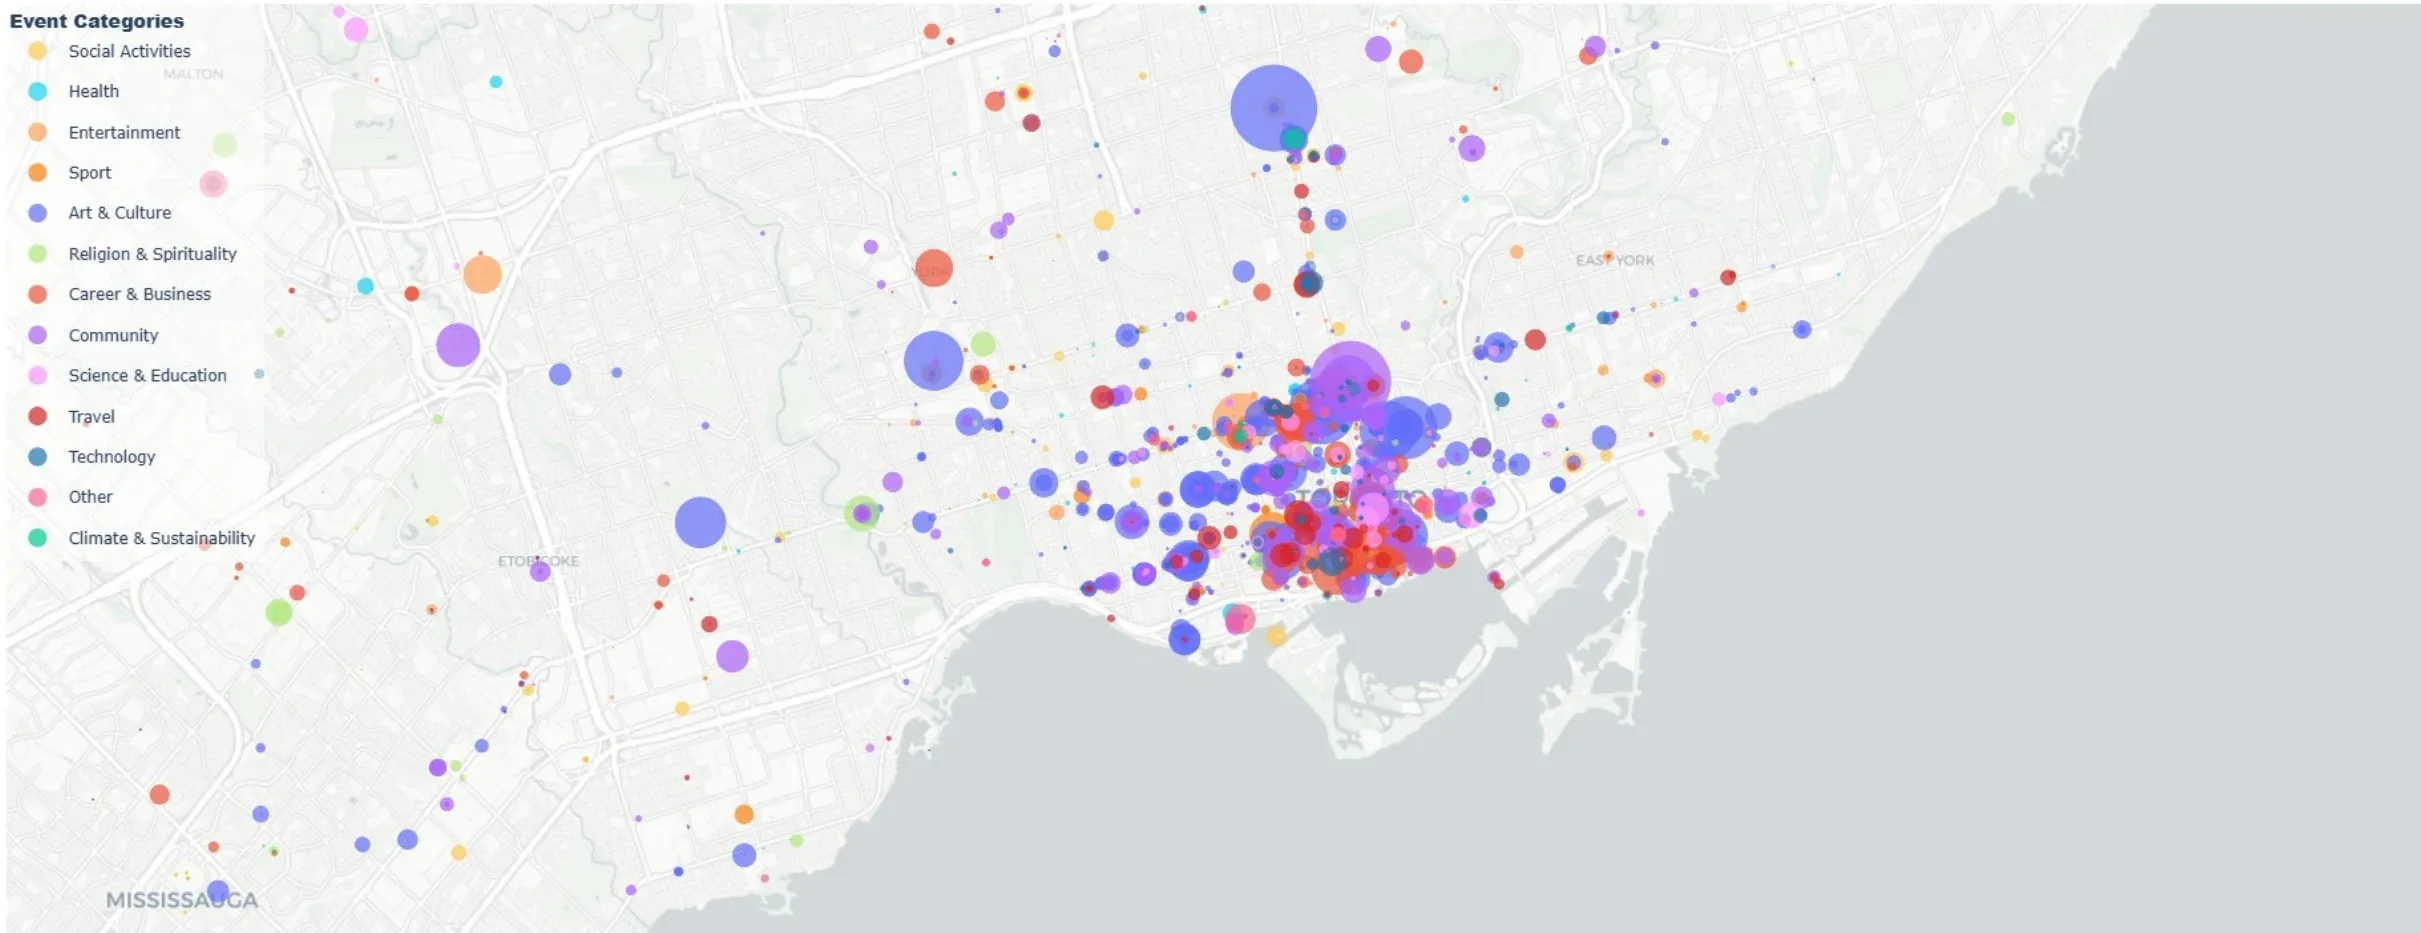
Event map by category and size
Every collected event plotted by location, coloured by category, sized by expected attendance. Downtown Toronto dominates; the outer GTA has events but far fewer.
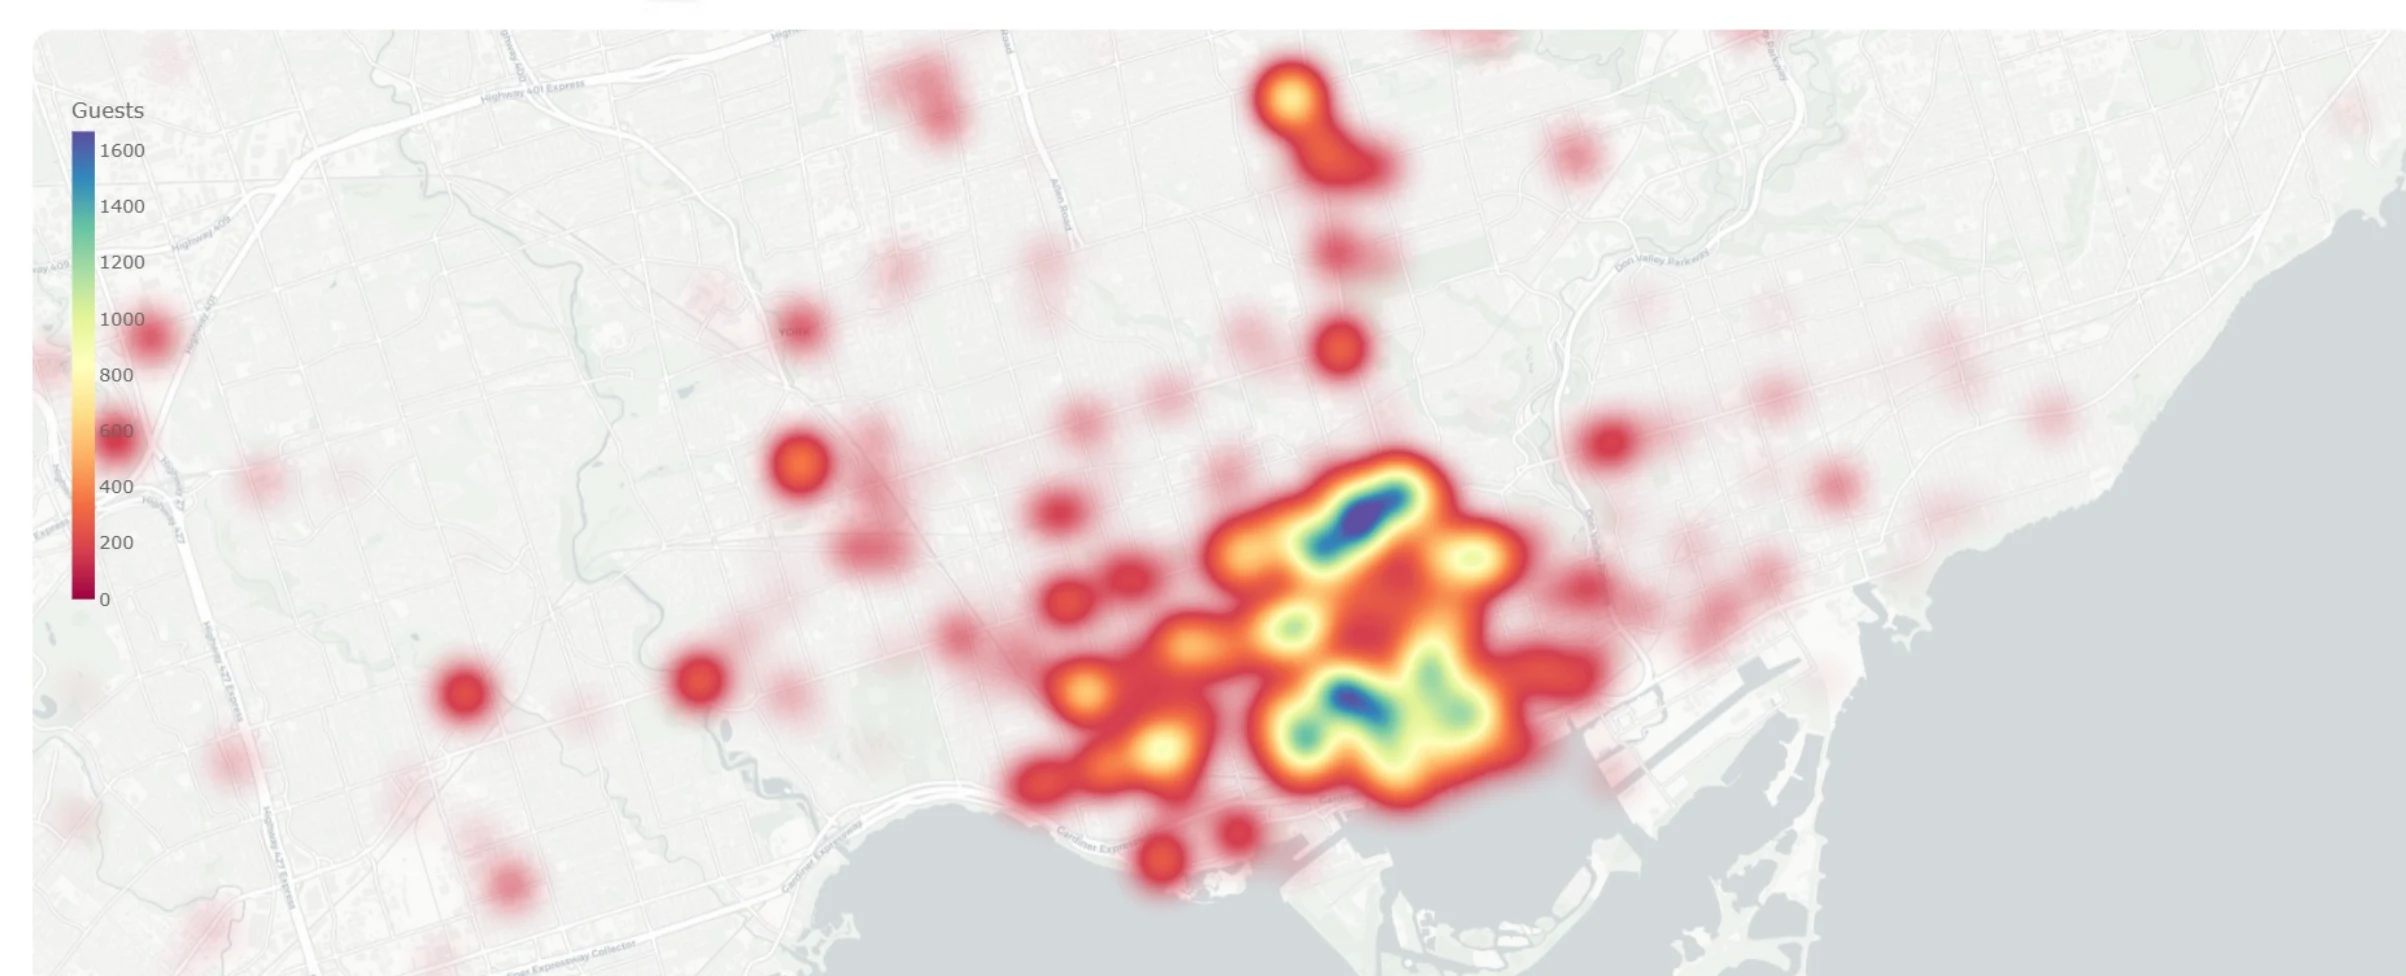
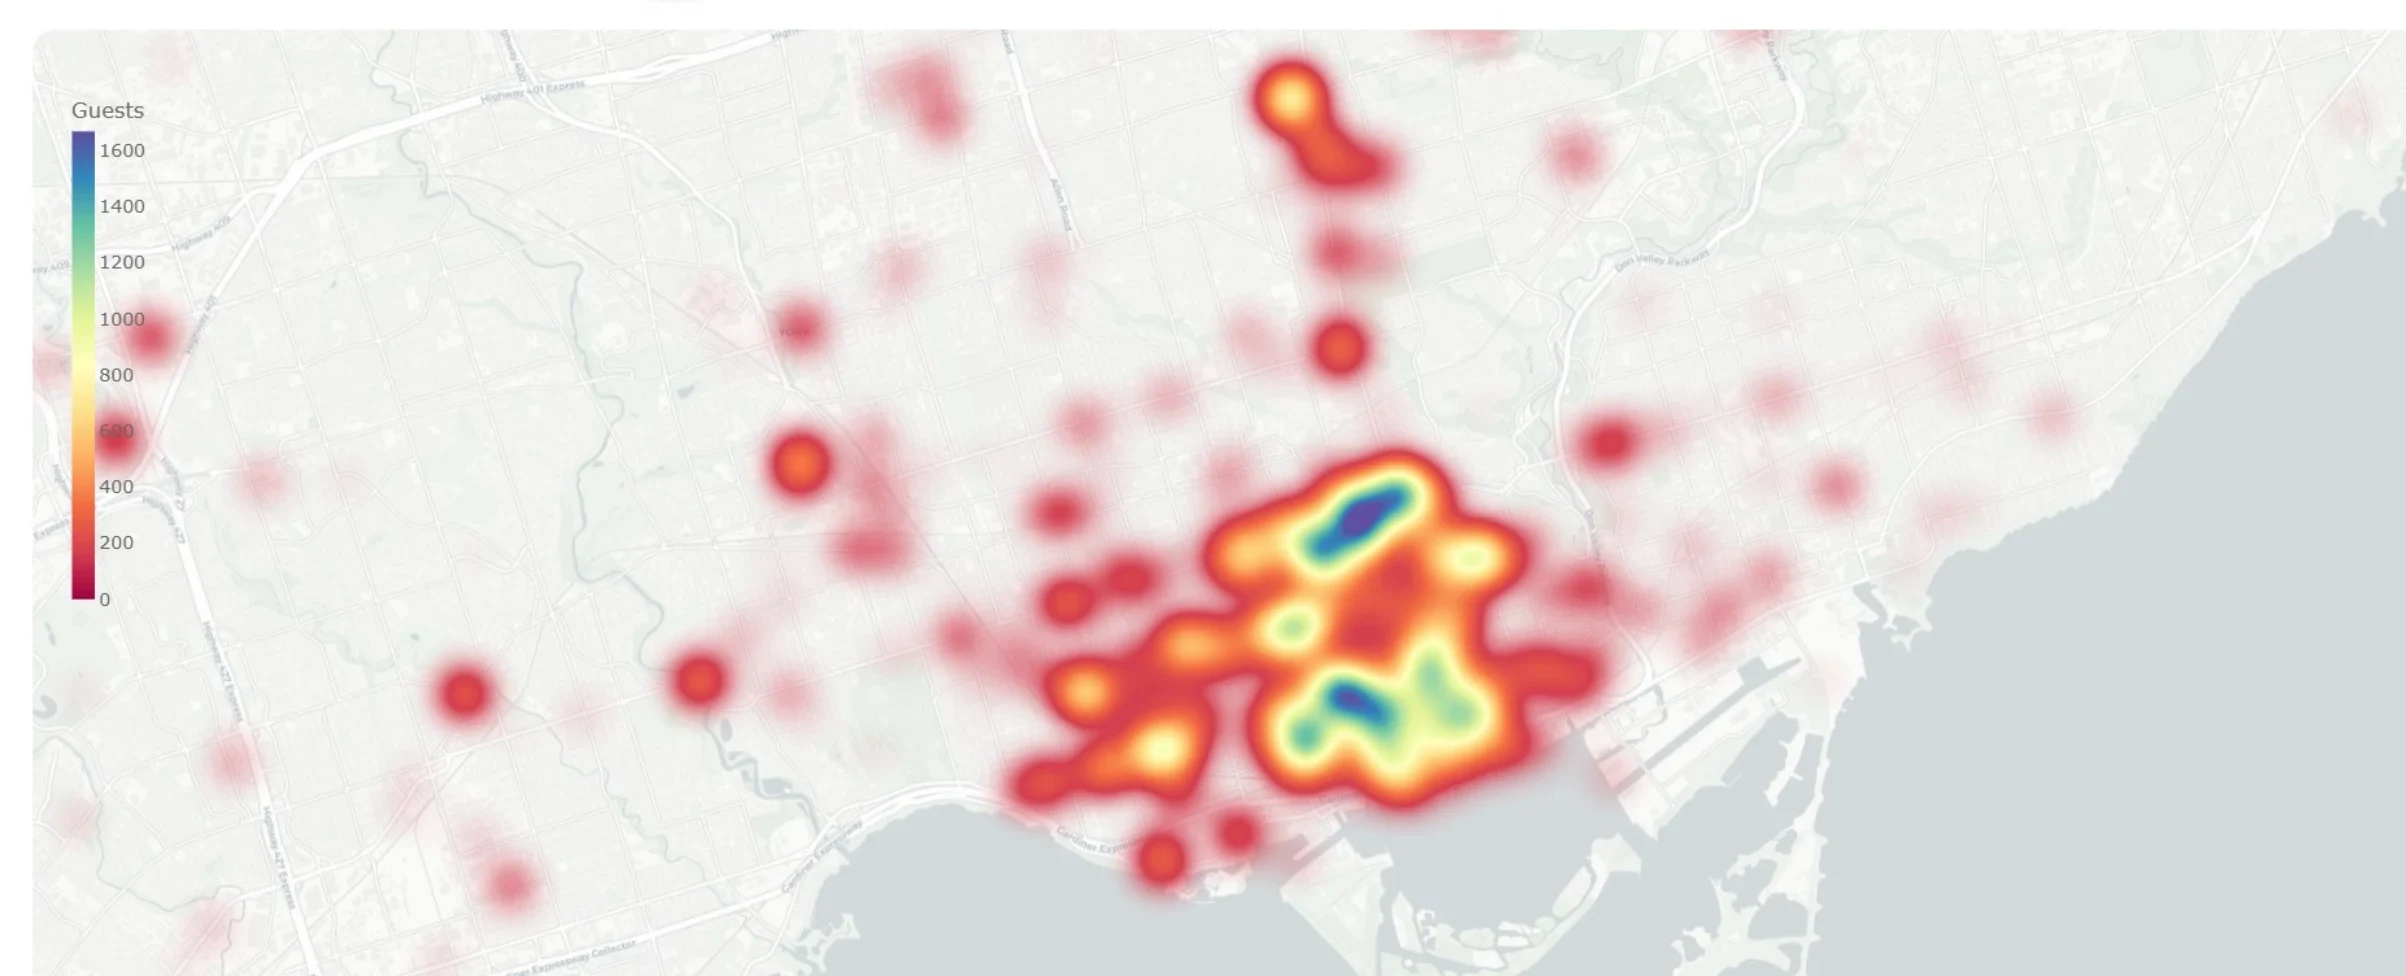
Attendance heatmap
Density of expected attendance across the GTA. The hot zone is the downtown core — but the heatmap also shows secondary clusters organizers might otherwise miss.
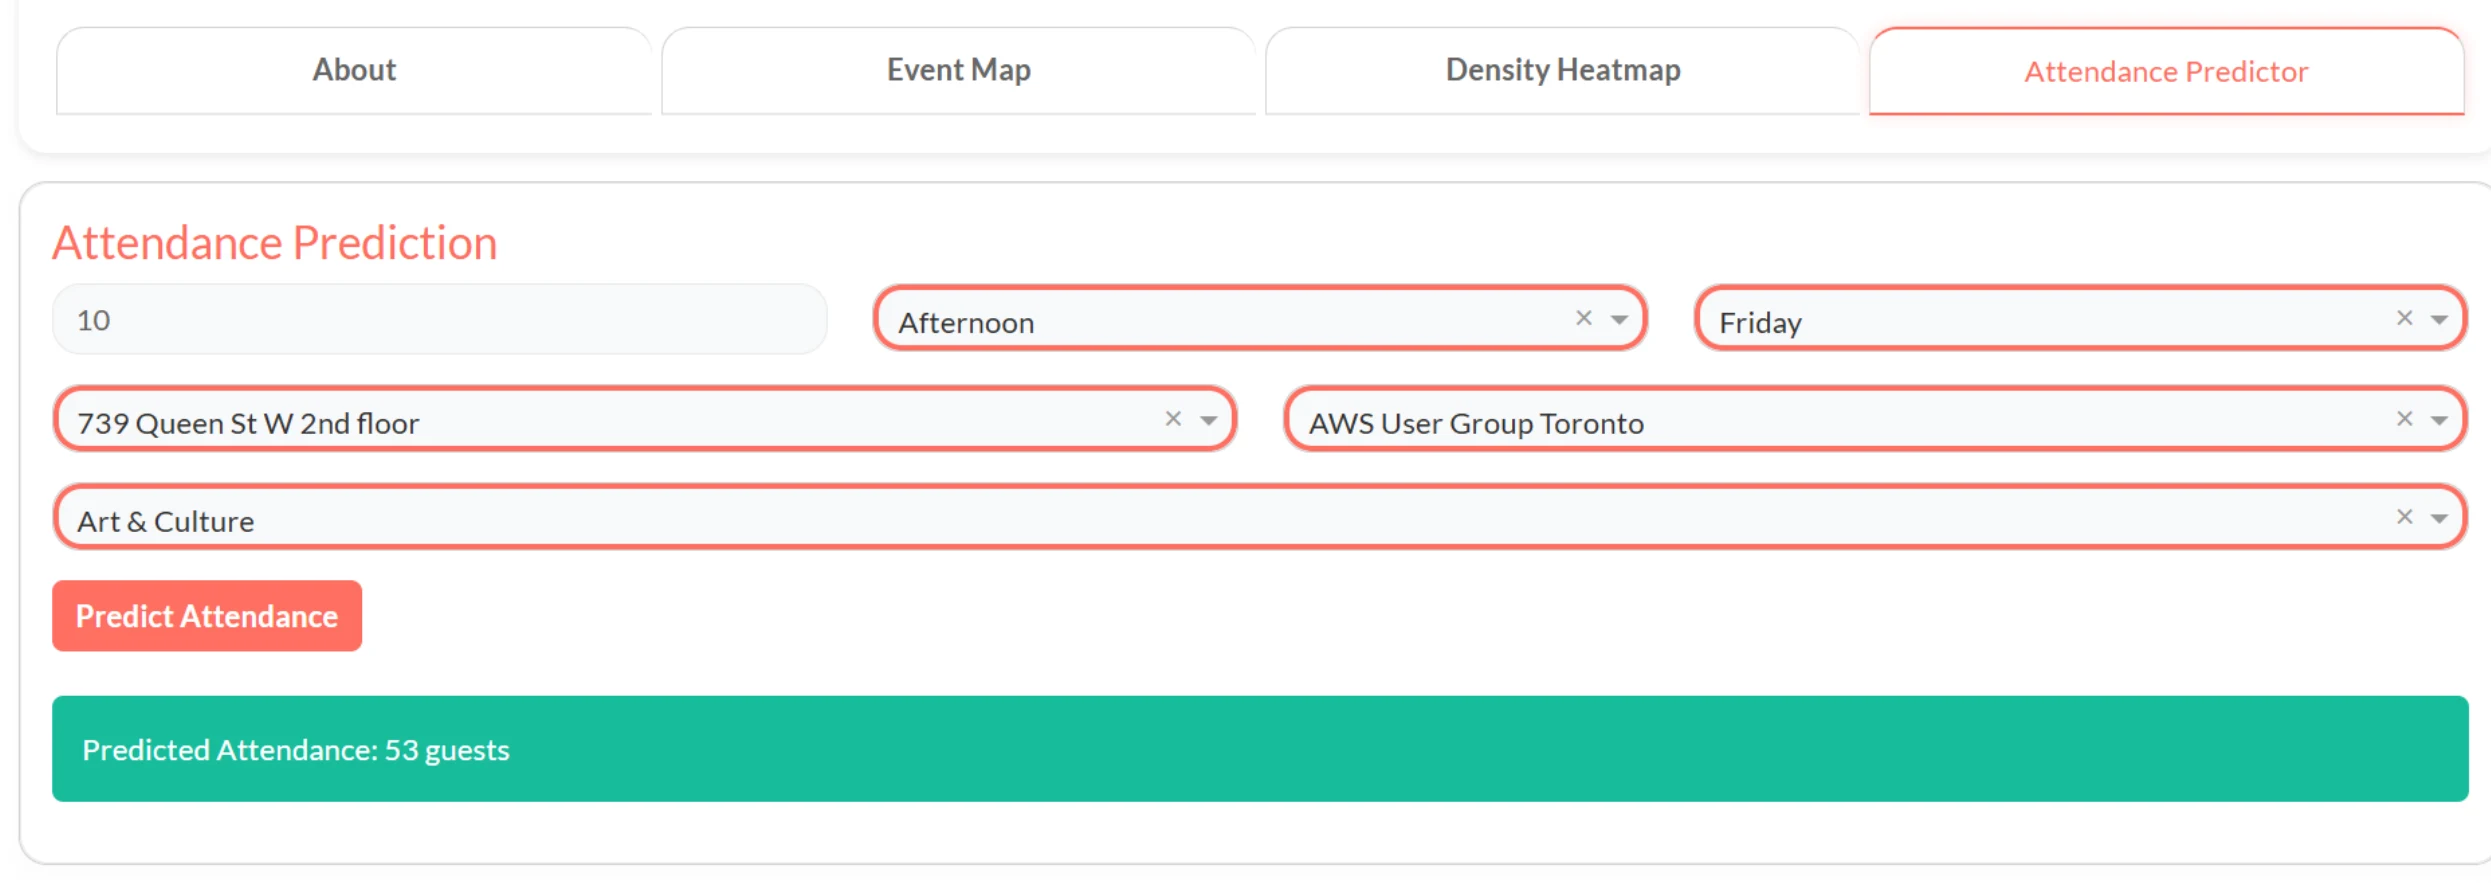
Attendance predictor
Pick a venue, organizer, category, day and time; get a forecast. Built on a model with target-encoded venue and organizer as the top features.
Multiple sources, different formats, one dataset
PopIn needed a picture of the GTA event scene that didn't exist anywhere as a dataset. Event information was spread across several public platforms, each with its own page structure, its own way of labelling categories (52 different labels between them) and its own way of reporting attendance. Attendance figures also change daily, so collecting once wasn't enough — the pipeline had to revisit events it already had. And once the data existed, there was a second problem: could general, public event data actually predict turnout for a specific event? Nobody had tested that.
Collect efficiently, unify once, then test the prediction
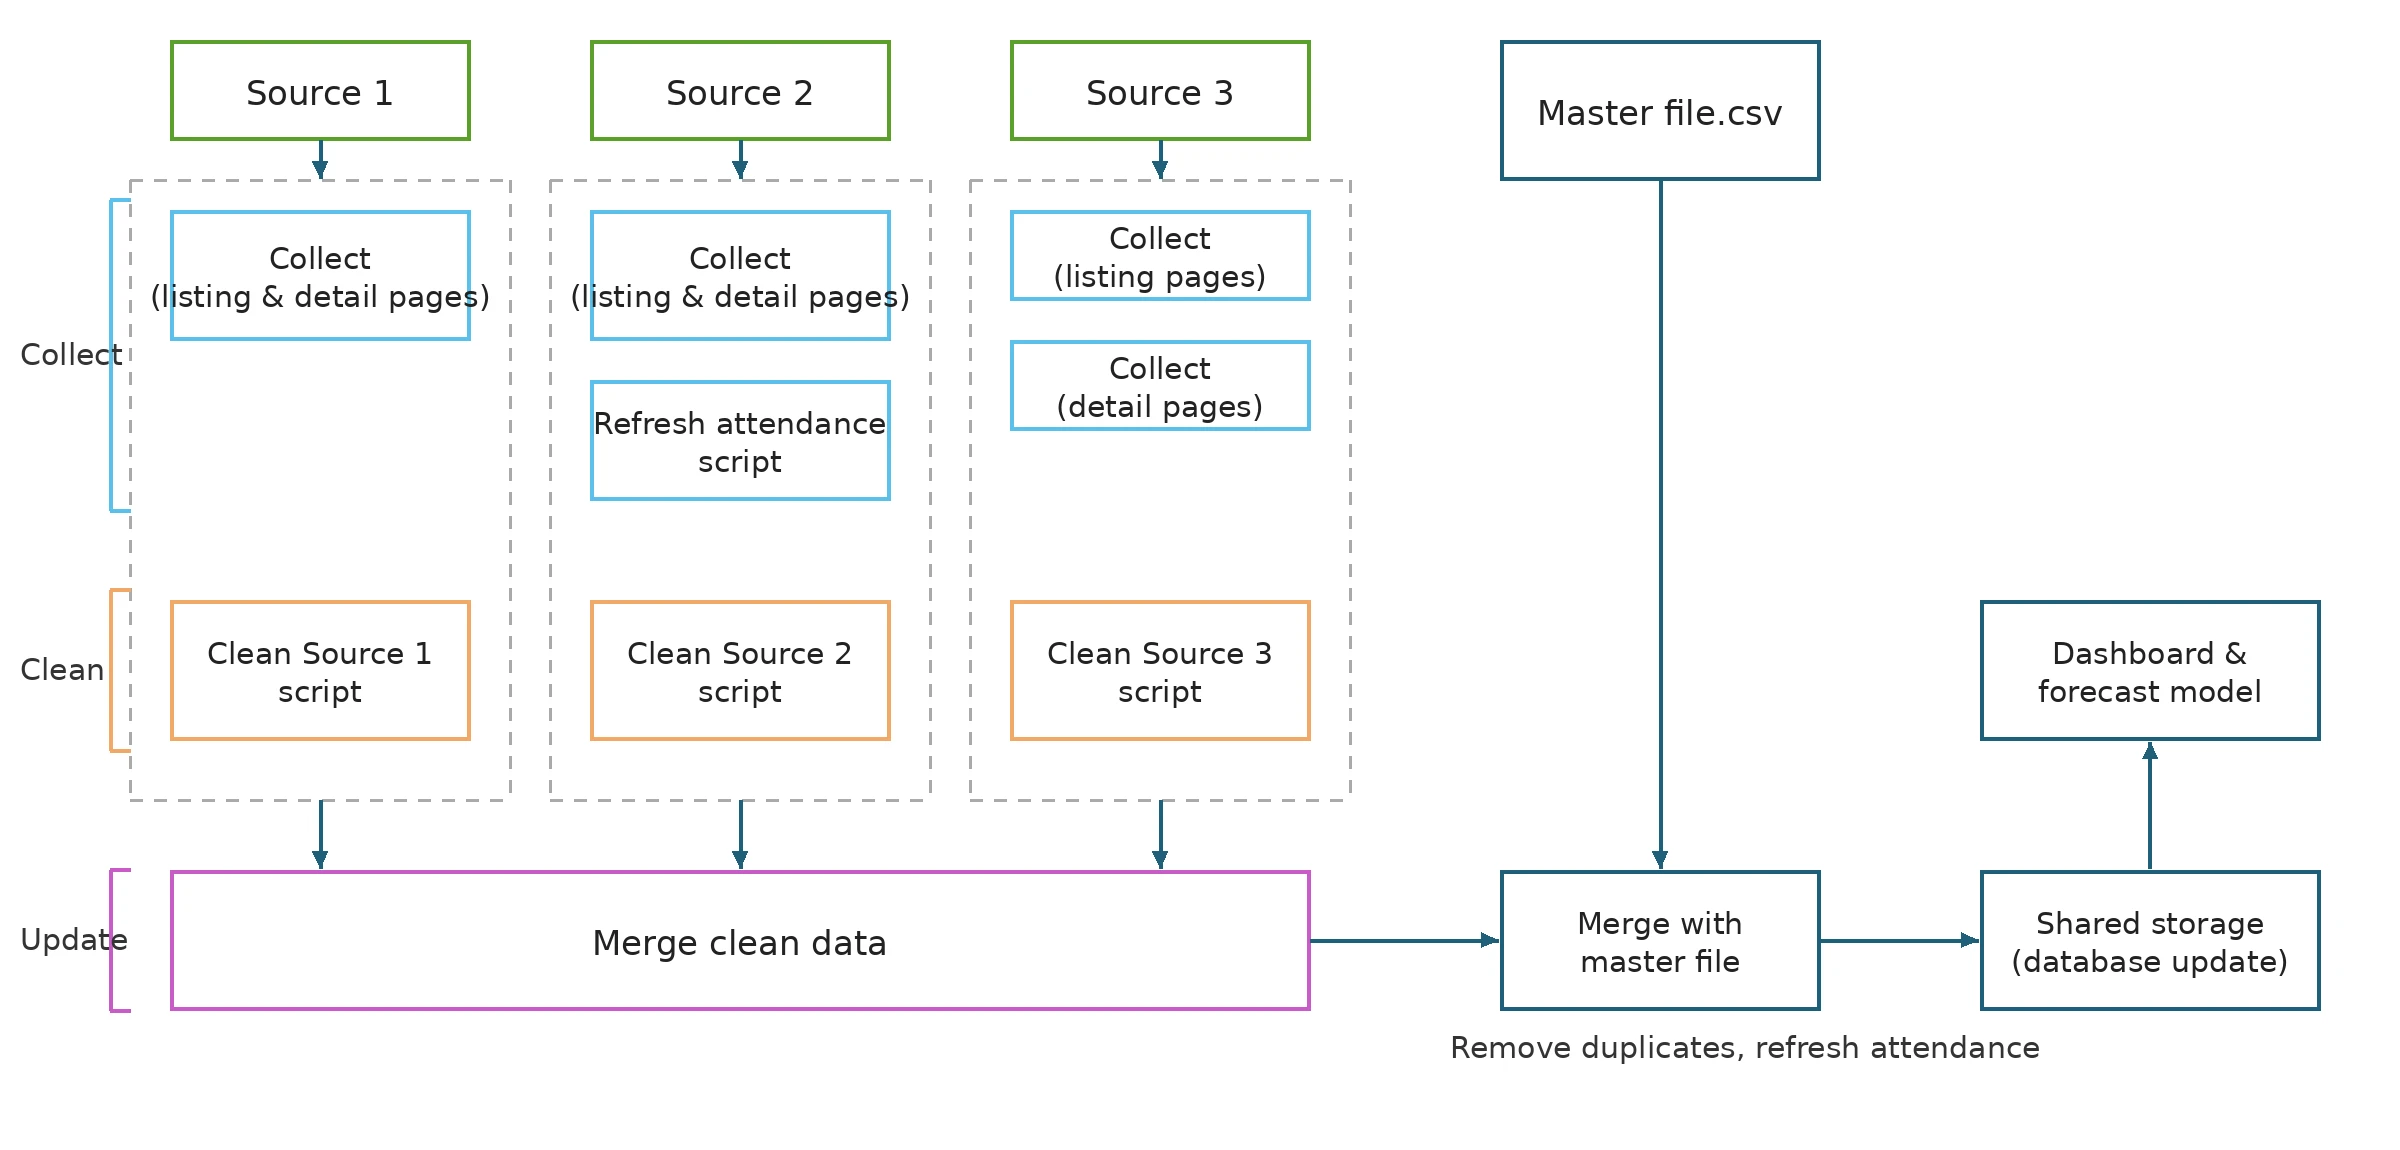
Each source got its own cleaning script to normalize dates, times, locations and prices into one schema, and a merge step that deduplicates against the master file and refreshes attendance for events already collected. For categories, I mapped the 52 raw labels into 13 general categories and 22 sub-categories with keyword rules, then trained a classifier (91% accuracy) to fill the half of the dataset that had no sub-category. With a clean, unified dataset, the team could test the prediction question: a model using only public event attributes — organizer, venue, category, day, time, price — explained about 40% of the variance in attendance. Organizer and venue turned out to be the strongest predictors, not price.
- Role
- Team lead — data collection, pipeline, categorization, dashboard and heatmap
- Team
- Olga Evtushenko, Taranjeet Kaur
- Timeline
- Nov 2024 – Apr 2025 (383 hours logged)
- Next
- Product Lead at PopIn
Where the Time Went
Half the project was getting the data
We budgeted 288 development hours. We logged 383. Data collection and management took 180 of them — nearly half the project — against 80 for modelling and 68 for the web app. That ratio wasn't a planning failure; it's what building a real dataset costs.
The recommendation we left PopIn with reflects that: the collection scripts need monthly maintenance, and the category mapping should move from static rules to a model that adapts as sources change their labels.
The Numbers Behind the Pipeline
- Spent on data collection and management, out of 383 total
- 180 hSpent on data collection and management, out of 383 total
- GTA cities covered
- 20GTA cities covered
- Share of events that are new each week — the rest are updates on events already collected
- 20–25%Share of events that are new each week — the rest are updates on events already collected
- Accuracy of the sub-category classifier that filled the gaps keyword rules couldn't
- 91%Accuracy of the sub-category classifier that filled the gaps keyword rules couldn't
Technical Foundation
Web scraping
Python with BeautifulSoup for static pages, Selenium for dynamic content, direct JSON API calls where available.
Data pipeline
Per-source cleaning scripts, one schema, merge-and-dedupe against a master file with daily attendance refresh.
Categorization
Keyword-rule mapping to 13 general and 22 sub-categories, plus a logistic regression classifier for unlabelled events.
Dashboard
Plotly Dash web app: event map, density heatmap, and attendance predictor with filters by category, date and location.
Forecasting model
Log-transformed attendance target, target-encoded venue and organizer, R² ≈ 0.40. Built by the team; I owned the features that fed it.
Project management
Requirements in term one, design–development–testing–release in term two; hours tracked by job.